Before we Start
Last updated on 2026-07-28 | Edit this page
Estimated time: 15 minutes
Overview
Questions
- “What is EDA?”
- “How to get ready to do data analysis?”
- “How to get the data we are working with?”
Objectives
- “Make sure tidyverse is updated.”
- “Make a new project.”
- “Organize your folders.”
- “Download the data.”
What is EDA?
EDA stands for Exploratory Data Analysis. It is a process of analyzing and summarizing a dataset in order to understand its main characteristics, such as the distribution of variables, the presence of outliers, and the relationship between different variables.
In R, EDA typically involves using a combination of visual and quantitative methods to explore and summarize the data, such as creating histograms, scatter plots, and summary statistics, which can be done using a variety of R packages such as ggplot2 and dplyr.
Getting set up
It is good practice to keep a set of related data, analyses, and text self-contained in a single folder called the working directory. All of the scripts within this folder can then use relative paths to files. Relative paths indicate where inside the project a file is located (as opposed to absolute paths, which point to where a file is on a specific computer). Working this way makes it a lot easier to move your project around on your computer and share it with others without having to directly modify file paths in the individual scripts.
Positron provides a helpful set of tools to do this through its “Project folder” interface, which not only creates a working directory for you but also remembers its location (allowing you to quickly navigate to it). The interface also (optionally) preserves custom settings and open files to make it easier to resume work after a break.
Create a new project folder and a new script file
- Under the File menu, click on New Folder from Template, choose R Project, then click Next
- Enter a name for this new folder and choose a convenient location for it. This will be your working directory for working on this project (e.g., ~/data-carpentry)
- Click on Next
- Choose Project Configurations by selecting the version of R you wish to work with.
- Click Create
- A new unsaved script is automatically created. Click ctrl/cmd-s to save
- Create a new file where you will type our scripts. Go to File > New File > R script. Click the save icon on your toolbar and save your script as “script.R”.
The simplest way to open an existing Positron project folder is to open Positron and select the project folder from the drop-down menu in the upper-right corner.
By doing it this way, you have easy acces to the data, plots and scripts belonging to your project folder.
Organizing your working directory
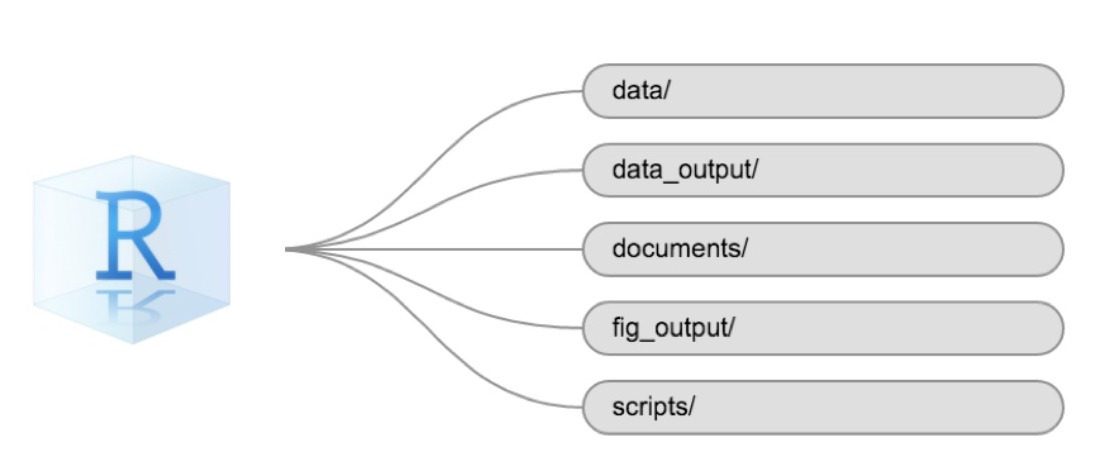
Using a consistent folder structure across your projects will help keep things organized and make it easy to find/file things in the future. This can be especially helpful when you have multiple projects. In general, you might create directories (folders) for scripts, data, and documents. Here are some examples of suggested directories:
-
data/Use this folder to store your raw data and intermediate datasets. For the sake of transparency and provenance, you should always keep a copy of your raw data accessible and do as much of your data cleanup and preprocessing programmatically (i.e., with scripts, rather than manually) as possible. -
data_output/When you need to modify your raw data, it might be useful to store the modified versions of the datasets in a different folder. -
documents/Used for outlines, drafts, and other text. -
fig_output/This folder can store the graphics that are generated by your scripts. -
scripts/A place to keep your R scripts for different analyses or plotting.
You may want additional directories or subdirectories depending on your project needs, but these should form the backbone of your working directory.
Not all projects needs the entire filestructure, but when analysing
data, we strongly recommend that you have at least the data
folder established as a place to store your original, raw, data.
The working directory
The working directory is an important concept to understand. It is the place where R will look for and save files. When you write code for your project, your scripts should refer to files in relation to the root of your working directory and only to files within this structure.
Using the Positron project folder structure makes this easy and ensures that your working directory is set up properly. If you need to check it, you can use getwd(). If for some reason your working directory is not the same as the location of your Positron project folder, it is likely that you opened an R script or RMarkdown file.
Is everything up to date?
After setting up our project, it is time to make sure our libraries are up to date.
Run the install.packages() functions on the libraries you are going to use. In this case we are going to use the tidyverse packages, and the readxl package to import data:
R
install.packages("tidyverse")
install.packages("readxl")
Getting the data
Getting the data can be the most time consuming part of any dataanalysis.
In this workshop, we are going to analyse flight data. You should
already have downloaded the data. Move the file to the data
folder of your project.
If not, you will need to download the data, now:
R
download.file("https://raw.githubusercontent.com/KUBDatalab/R-EDA/main/episodes/data/flightdata.xlsx",
              "data/flightdata.xlsx", mode = "wb")
- “A good project is an organized project”