All Images
Descriptive Statistics
Figure 1
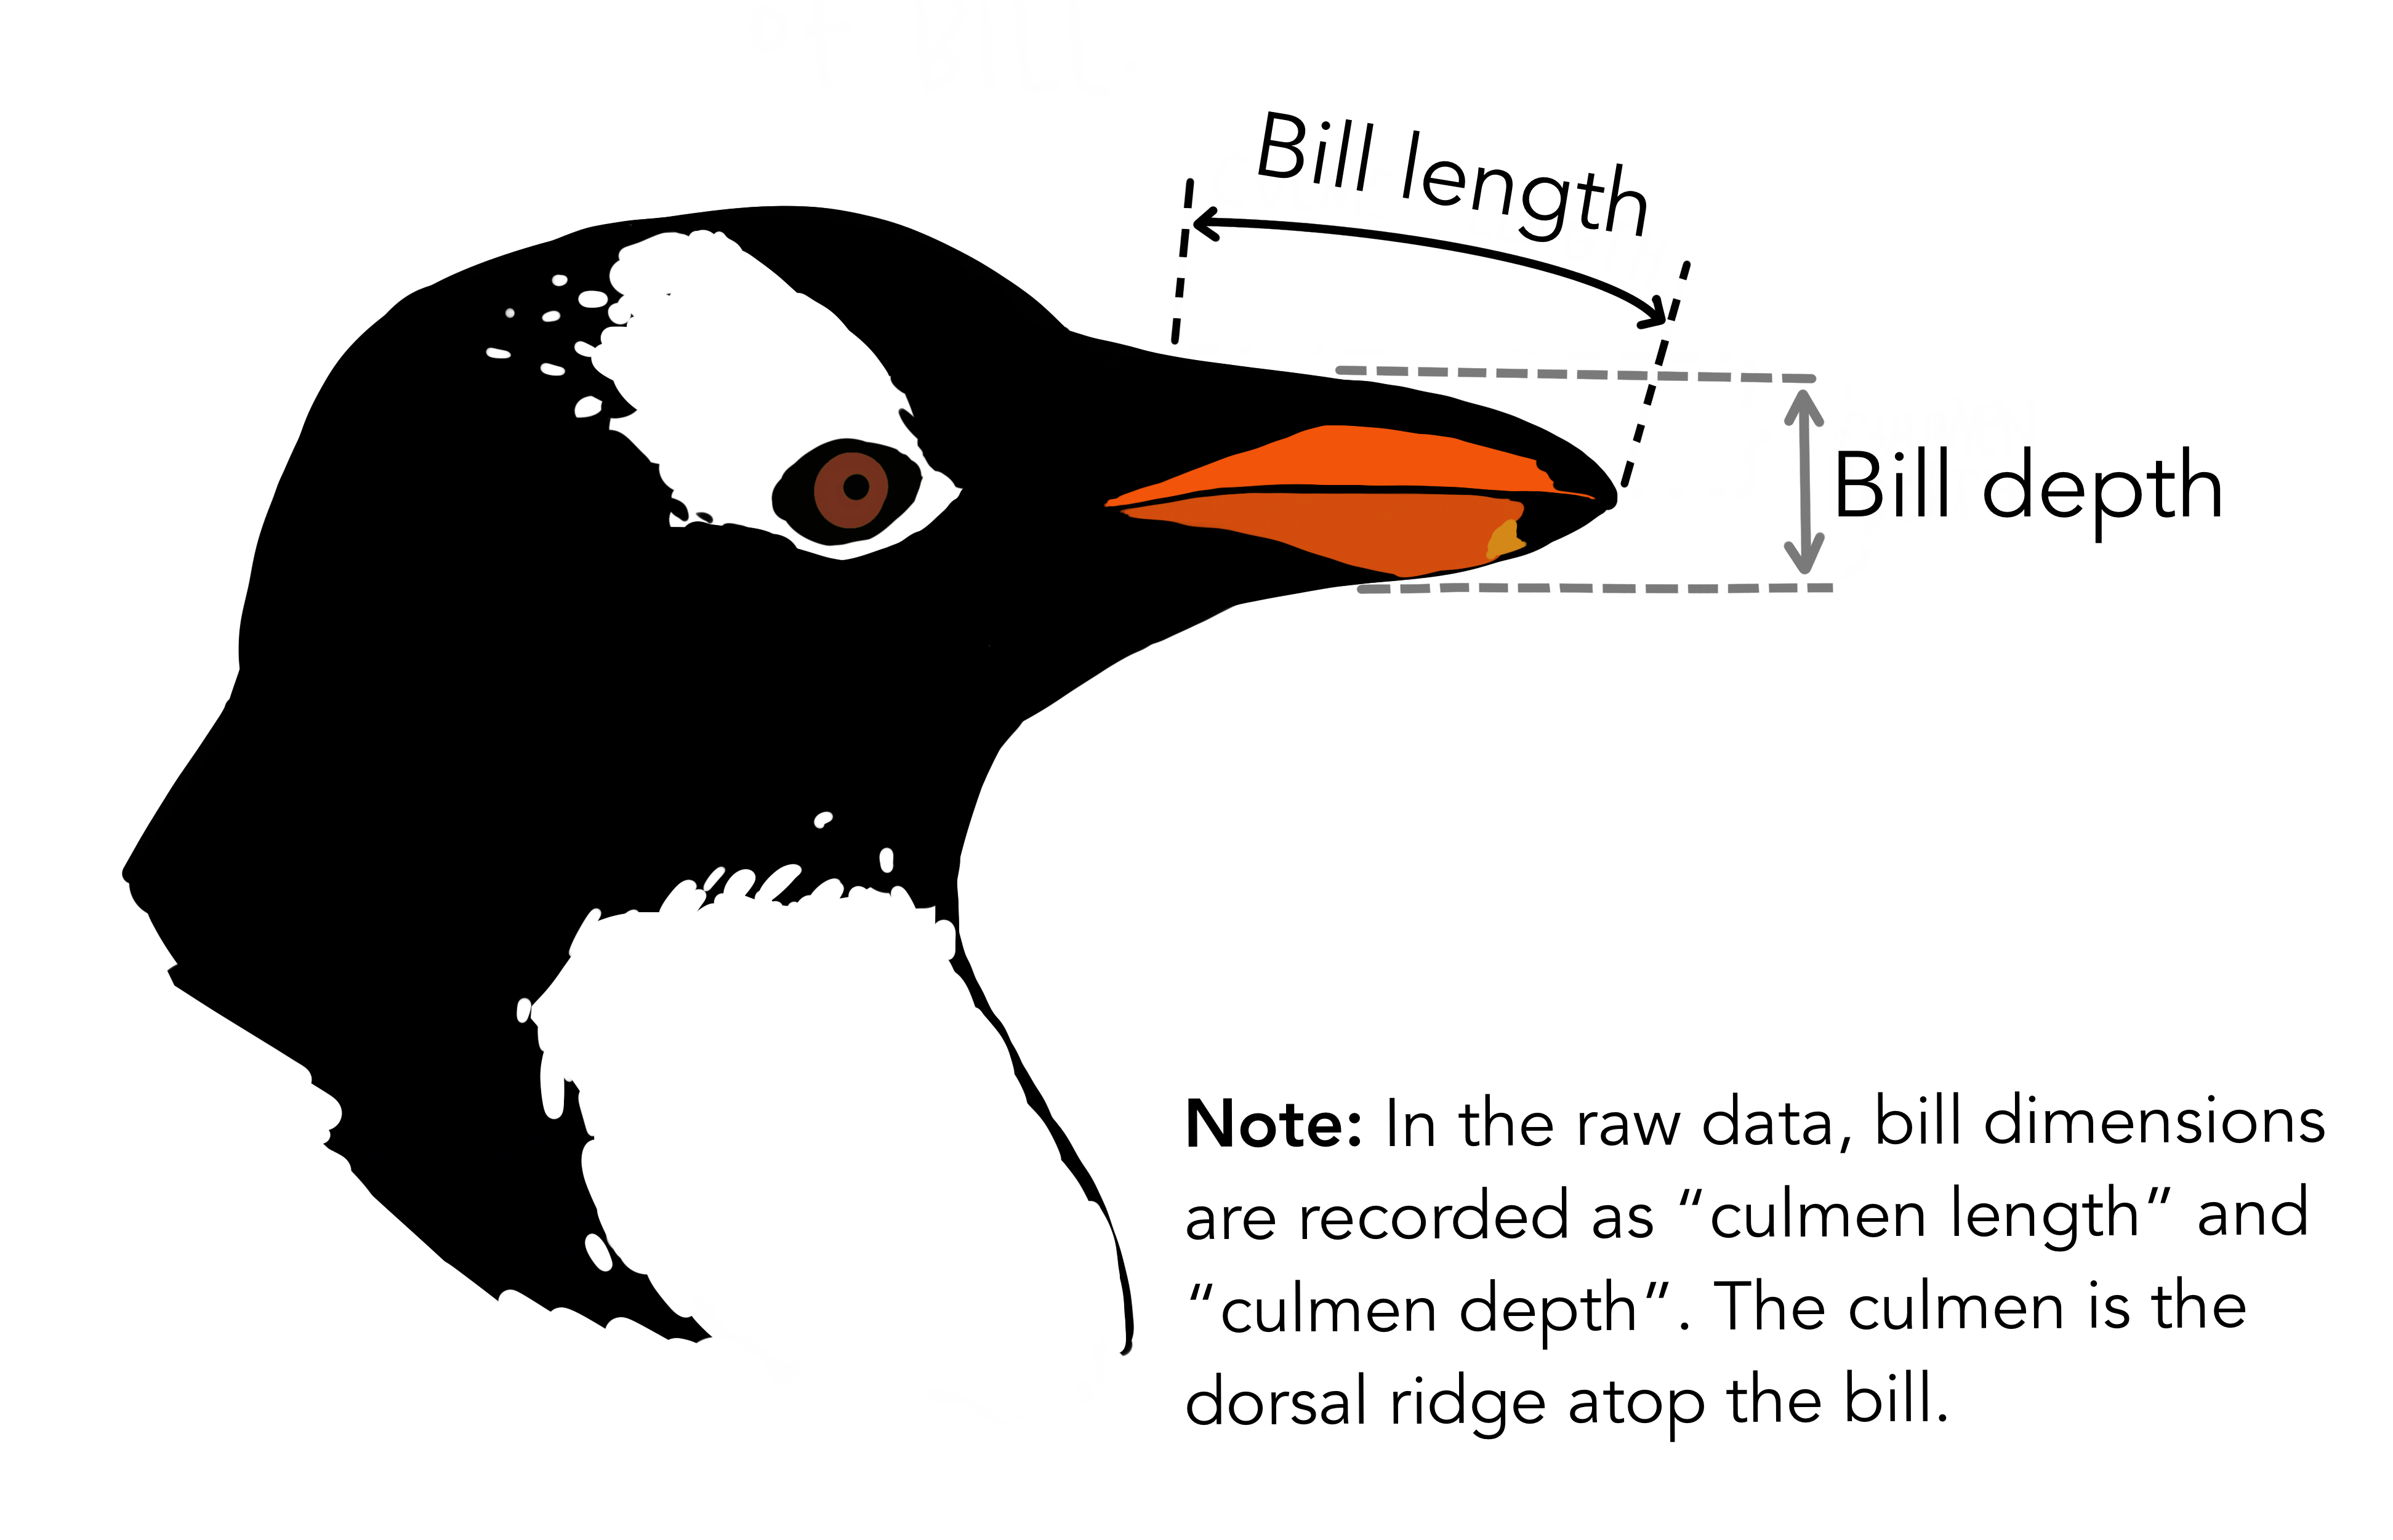 {Copyright Allison
Horst}
{Copyright Allison
Horst}
Figure 2
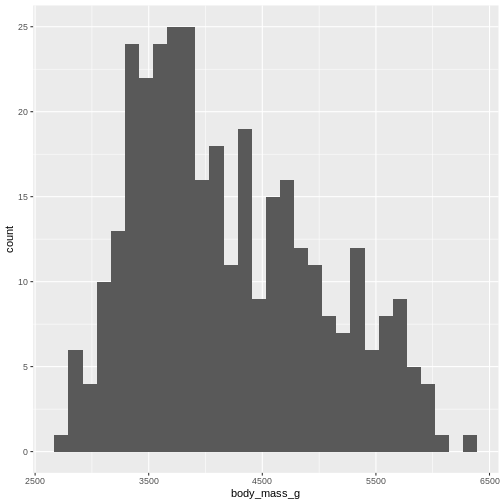
Figure 3
Figure 4
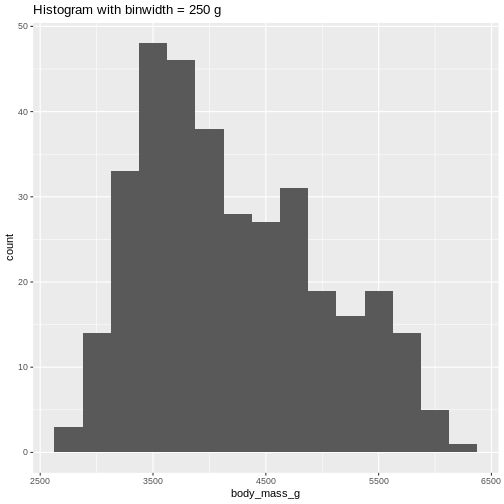 Or even specify the exact intervals we want, here intervals from 0 to
6500 gram in intervals of 250 gram:
Or even specify the exact intervals we want, here intervals from 0 to
6500 gram in intervals of 250 gram:
Figure 5
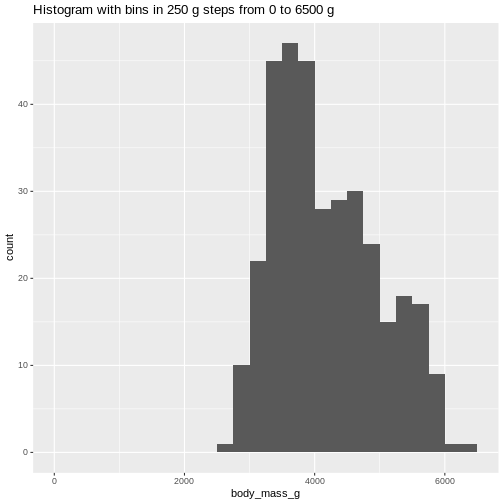 The histogram provides us with a visual indication of both range, the
variation of the values, and an idea about where the data is
located.
The histogram provides us with a visual indication of both range, the
variation of the values, and an idea about where the data is
located.
Figure 6
Figure 7
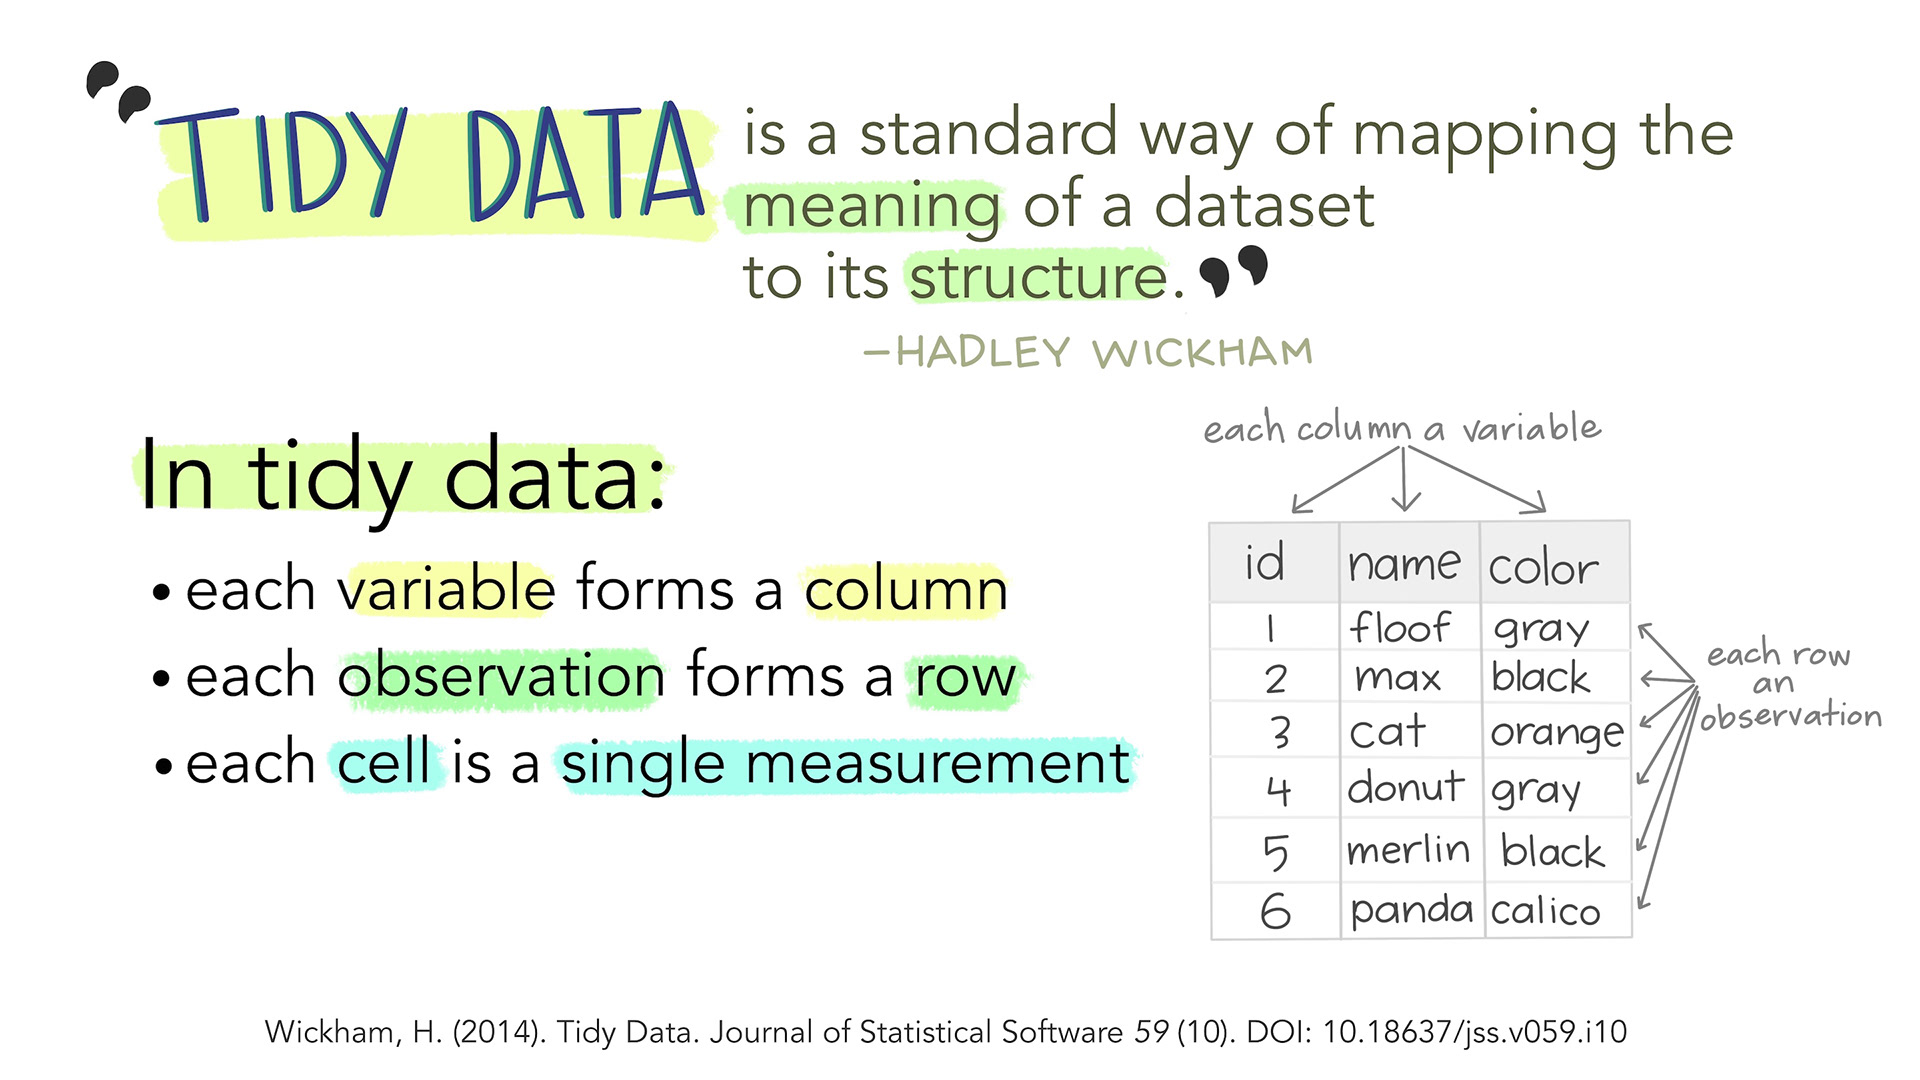
Tidy Data
Figure 1
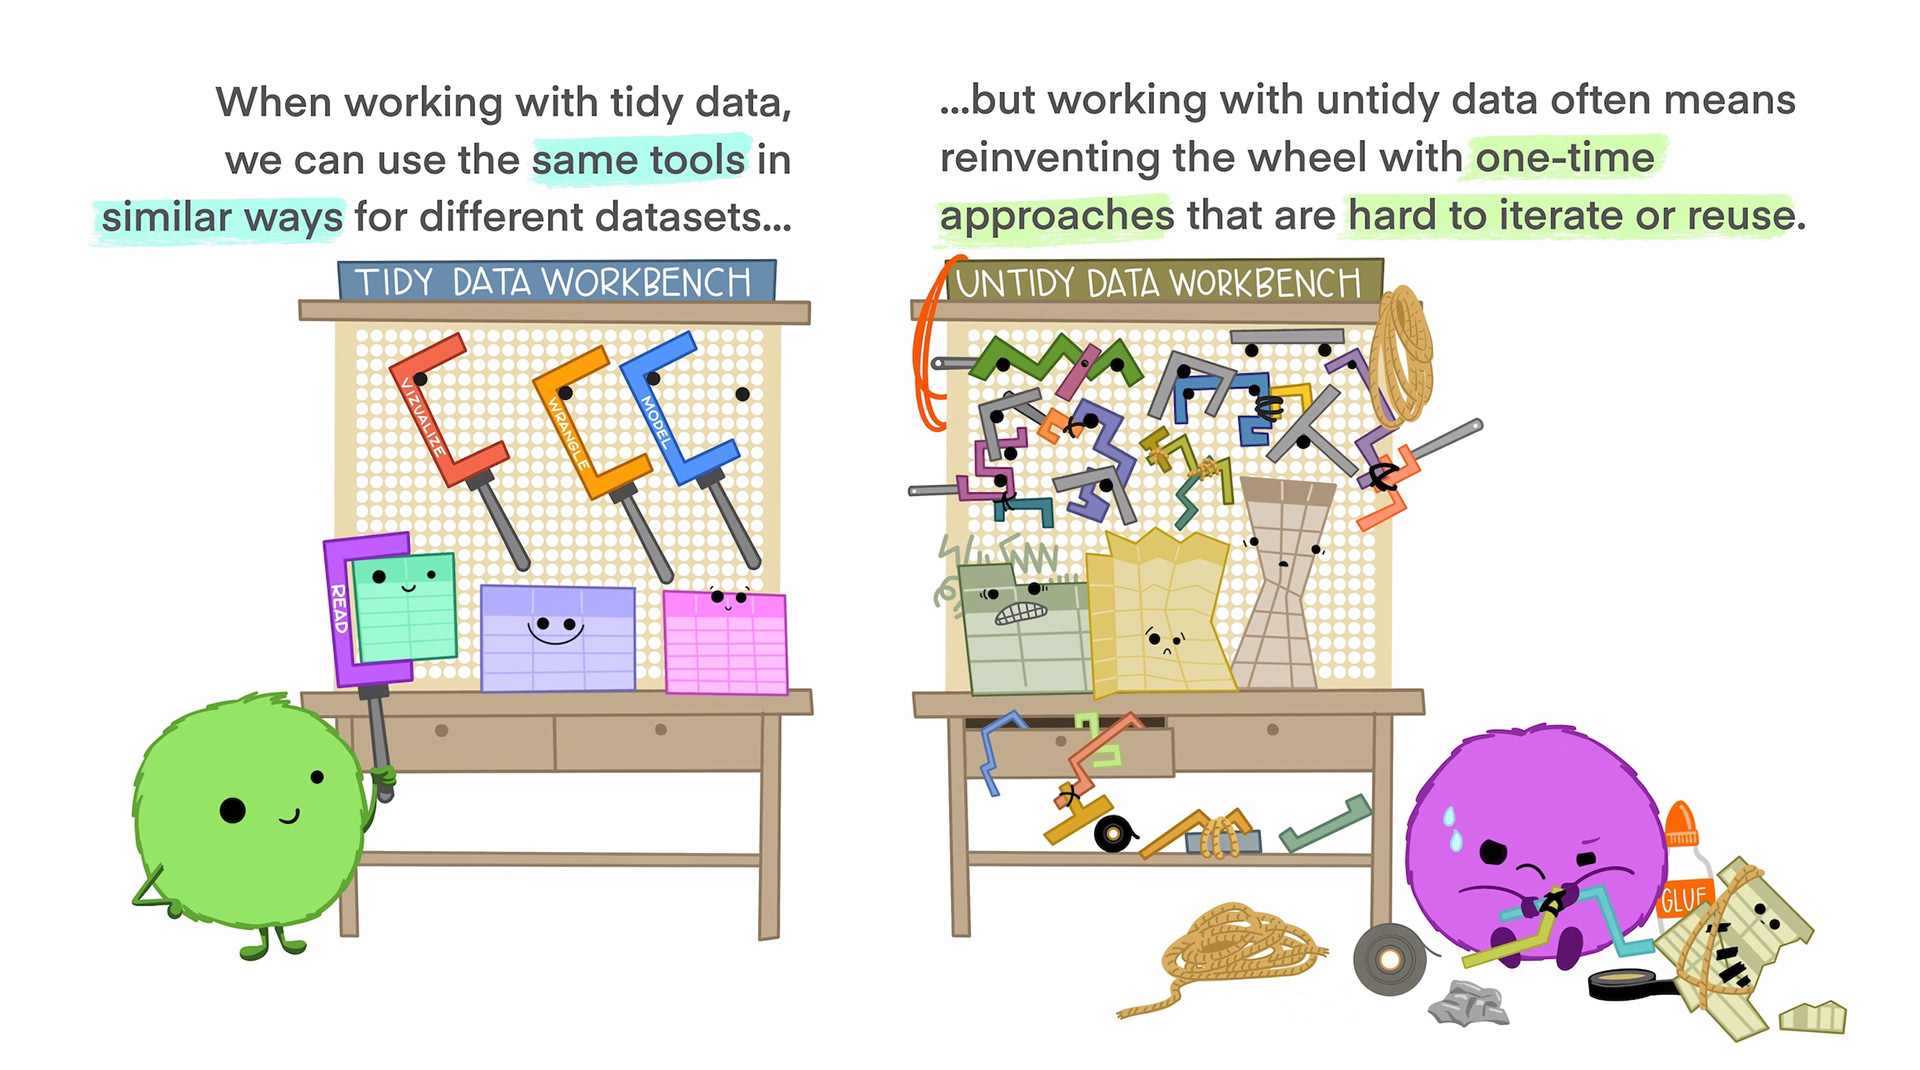
Figure 2
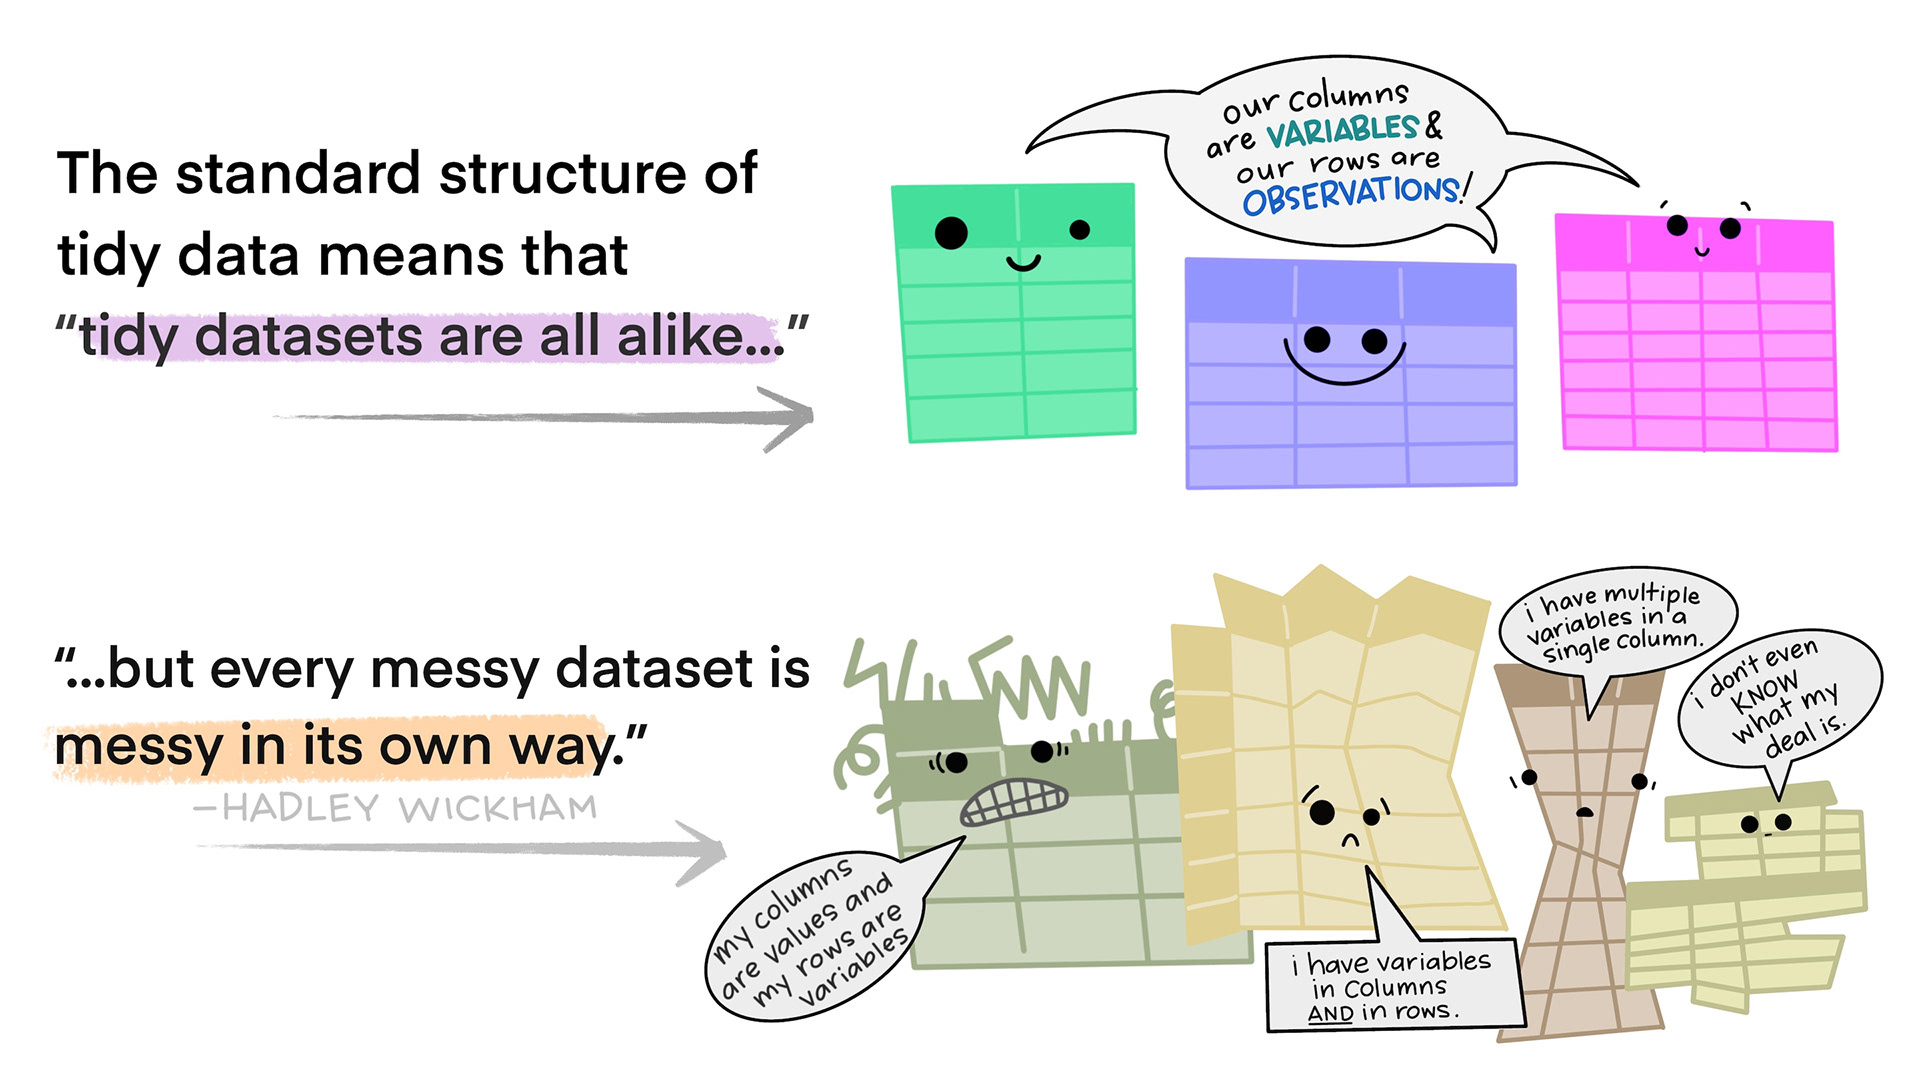
Figure 3
The normal distribution
Figure 1
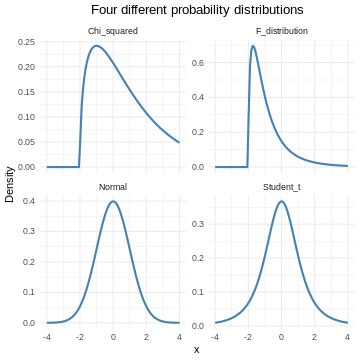
Figure 2
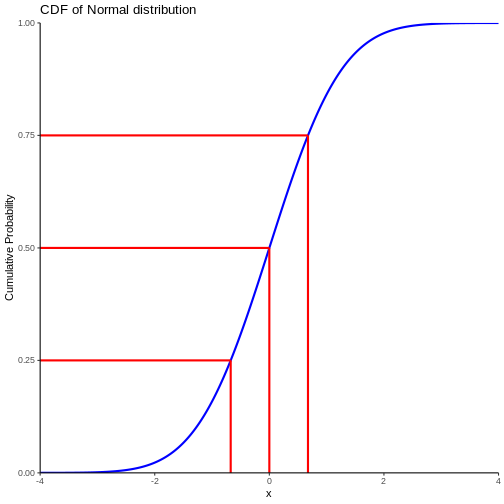
 The area under the curve is 1,
equivalent to 100%.
The area under the curve is 1,
equivalent to 100%.
Figure 3
Testing for normality
Figure 1
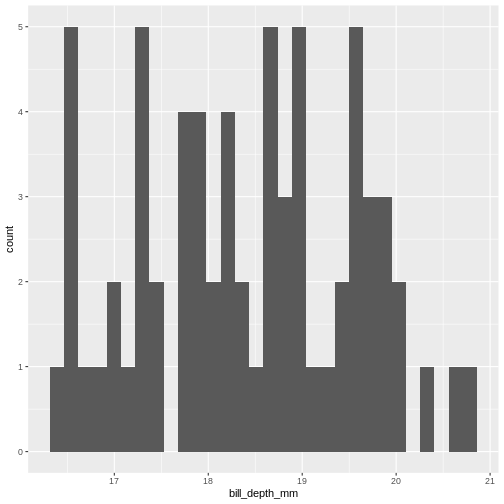
Figure 2
Figure 3
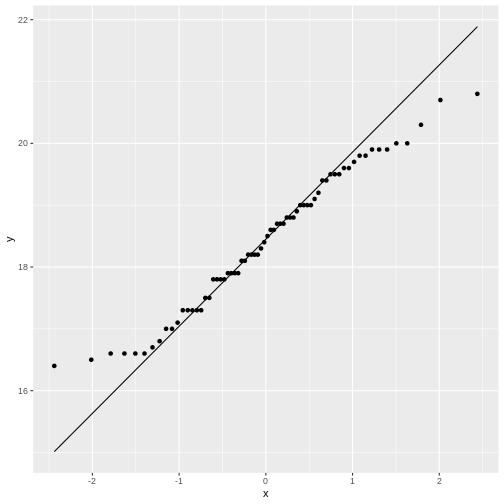
Figure 4
Linear regression
Figure 1
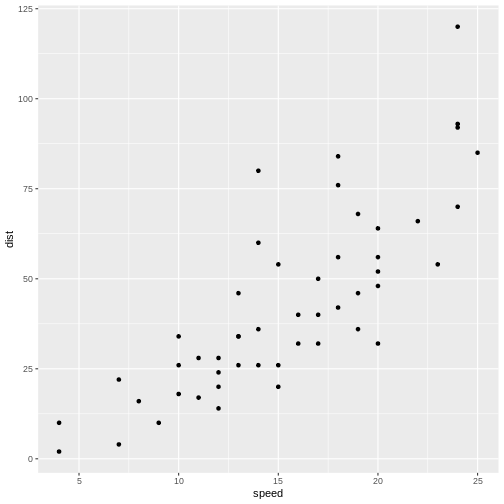
Figure 2
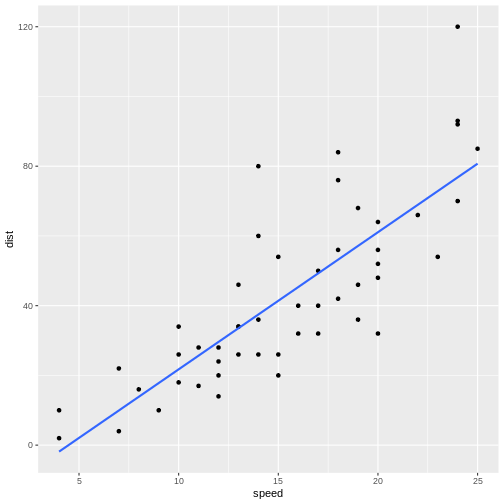
Figure 3
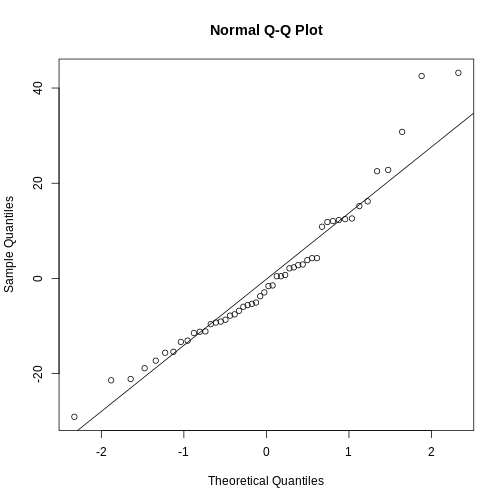
Figure 4
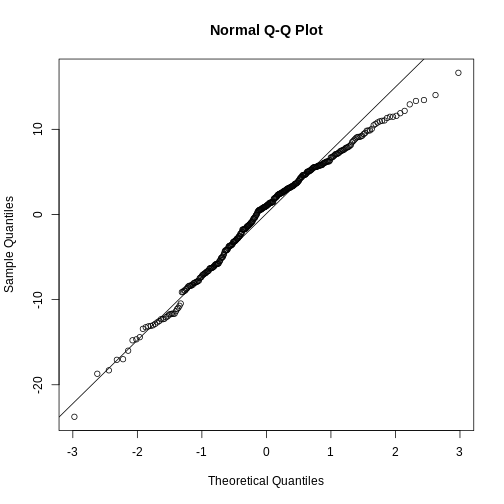 They are relatively close to normal.