
Sentiment analysis
Last updated on 2026-08-18 | Edit this page
Estimated time: 0 minutes
Overview
Questions
- What is a sentiment?
- How is sentiment analysis conducted?
Objectives
- Learn about different lexicons
- Learn how to add sentiment to words using lexicons
- Analyse and visualise the sentiments in a text
Sentiment analysis
Sentiment refers to the emotion or tone in a text. It is typically categorised as positive, negative or neutral. Sentiment is often used to analyse opinions, attitudes or emotions in written content. In this case the written content is newspaper articles.
Sentiment analysis is a method used to identify and classify emotions in textual data. This is often done using word list (lexicons). The goal is to determine whether a given text has a positive, negative or neutral tone.
In order to do a sentiment analysis on our data we From the previous section we have a dataset containing a list of words in the text without stopwords. To do a sentiment analysis we can use a so-called lexicon and assign a sentiment to each word. In order to do this we need an list of words and their sentiment. A simple form would be wether they are positive or negative.
There are multiple sentiment lexicons. For a start we will be using
the bing lexicon. This lexicon categorizes words as either
positive or negative.
R
get_sentiments("bing")
OUTPUT
# A tibble: 6,786 × 2
   word        sentiment
   <chr>       <chr>
 1 2-faces     negative
 2 abnormal    negative
 3 abolish     negative
 4 abominable  negative
 5 abominably  negative
 6 abominate   negative
 7 abomination negative
 8 abort       negative
 9 aborted     negative
10 aborts      negative
# ℹ 6,776 more rows
In order to use the bing-lexicon, we have to save
it.
R
bing <- get_sentiments("bing")
We now need to combine the sentiment with the words from the articles. This is done by performing an inner_join.
R
articles_bing <- articles_filtered |>
  inner_join(bing)
OUTPUT
Joining with `by = join_by(word)`R
articles_bing
OUTPUT
# A tibble: 123,667 × 8
      id date    section region author                 wordcount word  sentiment
   <dbl> <chr>   <chr>   <chr>  <chr>                      <dbl> <chr> <chr>
 1     1 2026-05 News    UK     Jessica Murray and Ro…      1328 warn… negative
 2     1 2026-05 News    UK     Jessica Murray and Ro…      1328 over… negative
 3     1 2026-05 News    UK     Jessica Murray and Ro…      1328 lagg… negative
 4     1 2026-05 News    UK     Jessica Murray and Ro…      1328 rapid positive
 5     1 2026-05 News    UK     Jessica Murray and Ro…      1328 slow  negative
 6     1 2026-05 News    UK     Jessica Murray and Ro…      1328 warn… negative
 7     1 2026-05 News    UK     Jessica Murray and Ro…      1328 effe… positive
 8     1 2026-05 News    UK     Jessica Murray and Ro…      1328 misu… negative
 9     1 2026-05 News    UK     Jessica Murray and Ro…      1328 over… negative
10     1 2026-05 News    UK     Jessica Murray and Ro…      1328 brea… positive
# ℹ 123,657 more rows
In R, inner_join() is commonly used to combine datasets
based on a shared column. In this case it is the word
column. inner_join() matches words from a text dataset, in
this case articles_filtered with words in the Bing
sentiment lexicon to determine whether they are positive or
negative.
Once we have the combined dataset we can make a sentiment analysis. A way to start could be by counting the number of positive and negative words used in the articles. This is done per section.
R
articles_bing |>
  group_by(section) |>
  summarise(positive = sum(sentiment == "positive"),
            negative = sum(sentiment == "negative"),
            difference = positive - negative)
OUTPUT
# A tibble: 5 × 4
  section   positive negative difference
  <chr>        <int>    <int>      <int>
1 Arts         11844    13555      -1711
2 Lifestyle    18337    13504       4833
3 News         11216    14220      -3004
4 Opinion       8452    11419      -2967
5 Sport        11350     9770       1580
The result shows the distribution of positive and negative words across sections. It also shows that Lifestyle has the highest number of positive words, and that oponion has the highest number of negative words. The section with the lowest difference is Arts.
Another way of presenting this analysis is by visualising it.
R
articles_bing |>
  group_by(section, date) |>
  summarise(positive = sum(sentiment == "positive"),
            negative = sum(sentiment == "negative"),
            difference = positive - negative) |>
  #ungroup() |>
  filter(section %in% c("Arts", "Sport")) |>
  ggplot(mapping = aes(x = date, y = difference, colour = section, group = section)) +
  geom_point() +
  geom_line()
OUTPUT
`summarise()` has regrouped the output.
ℹ Summaries were computed grouped by section and date.
ℹ Output is grouped by section.
ℹ Use `summarise(.groups = "drop_last")` to silence this message.
ℹ Use `summarise(.by = c(section, date))` for per-operation grouping
  (`?dplyr::dplyr_by`) instead.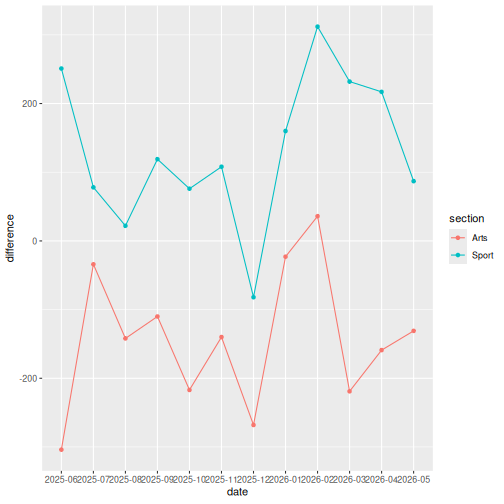
By looking at the graphs, we can see that the wording in December in Sport articles is quite negative compared to February. If we had a data set covering more years it would be worth investigating if this was a tendency or just a coincidence.
For now, it might be interesting to read the articles from December and February in order to compare their content. To that end we can create a new dataset containing articles from the Sport section from December and February.
R
interesting_articles <- articles |>
  filter(section == "Sport") |>
  filter(date %in% c("2025-12", "2026-02"))
This can be saved as csv-file for further analysis.
R
write_csv(interesting_articles, "data_out/interesting_articles.csv")
With bing we only look at the sentiment in a binary
fashion - a word is either positive or negative. If we do a similar
analysis with AFINN, it looks different. Like
bing, AFINN is a sentiment lexicon. It
consists of a list of words that are assigned sentiment scores ranging
from -5 (very negative) to +5 (very positive). Note that
AFINN does not contain a 0.
AFINN is part of the package textdata, so
we need to install the package and run the library in order to be able
to use it in this script.
R
install.packages("textdata")
library(textdata)
So that we can use the AFINN-lexicon, we have to save
it.
R
afinn <- get_sentiments("afinn")
This is what it looks like.
R
afinn
OUTPUT
# A tibble: 2,477 × 2
   word       value
   <chr>      <dbl>
 1 abandon       -2
 2 abandoned     -2
 3 abandons      -2
 4 abducted      -2
 5 abduction     -2
 6 abductions    -2
 7 abhor         -3
 8 abhorred      -3
 9 abhorrent     -3
10 abhors        -3
# ℹ 2,467 more rowsBemærk at vi ikke på github kan downloade afinn. Derfor har vi downloaded afinn datasættet til en csv-fil pr 21. november 2025. Med andre ord er der risiko for at siden kører med et uopdateret datasæt. - TROR IKKE VI BEHØVER DET MERE - SNAK MED CHRISTIAN
We now need to combine the sentiment to the words from our articles. We do this by performing an inner_join.
R
articles_afinn <- articles_filtered |>
  inner_join(afinn)
OUTPUT
Joining with `by = join_by(word)`Since the AFINN lexicon ascribes either negative or
positive numbers each word (instead of strings, as bing
does),we can easily calculate the difference as we did with
bing.
R
articles_afinn |>
  group_by(section) |>
  summarise(different = sum(value))
OUTPUT
# A tibble: 5 × 2
  section   different
  <chr>         <dbl>
1 Arts            730
2 Lifestyle     11230
3 News          -5744
4 Opinion       -4335
5 Sport          8045
It could be interesting to see how the different levels of negative and positive words are used in the different sections.
R
articles_afinn |>
  #group_by(section) |>
  count(section, value) |>
  pivot_wider(names_from = value, values_from = n)
OUTPUT
# A tibble: 5 × 11
  section    `-5`  `-4`  `-3`  `-2`  `-1`   `1`   `2`   `3`   `4`   `5`
  <chr>     <int> <int> <int> <int> <int> <int> <int> <int> <int> <int>
1 Arts         14   203  2122  4807  2718  3189  4287  2037   574    28
2 Lifestyle     3   130  1444  4139  3560  5126  6468  2683   416    32
3 News          1    94  2283  6081  3860  4917  4922   699   155     6
4 Opinion       7    72  1802  4549  2496  2963  3610   721   153     6
5 Sport         9    52  1123  3563  2598  2871  3859  1894  1195    68
This is what it looks like if we add proportions to the calculation.
R
articles_afinn |>
  count(section, value) |>
  group_by(section) |>
  mutate(proportion = n / sum(n)) |>
  ungroup() |>
  select(-n) |>
  #arrange(desc(proportion)) |>
  pivot_wider(names_from = value, values_from = proportion)
OUTPUT
# A tibble: 5 × 11
  section     `-5`    `-4`   `-3`  `-2`  `-1`   `1`   `2`    `3`     `4`     `5`
  <chr>      <dbl>   <dbl>  <dbl> <dbl> <dbl> <dbl> <dbl>  <dbl>   <dbl>   <dbl>
1 Arts     7.01e-4 0.0102  0.106  0.241 0.136 0.160 0.215 0.102  0.0287  1.40e-3
2 Lifesty… 1.25e-4 0.00542 0.0602 0.172 0.148 0.214 0.269 0.112  0.0173  1.33e-3
3 News     4.34e-5 0.00408 0.0992 0.264 0.168 0.214 0.214 0.0304 0.00673 2.61e-4
4 Opinion  4.27e-4 0.00440 0.110  0.278 0.152 0.181 0.220 0.0440 0.00934 3.66e-4
5 Sport    5.22e-4 0.00302 0.0652 0.207 0.151 0.167 0.224 0.110  0.0693  3.95e-3
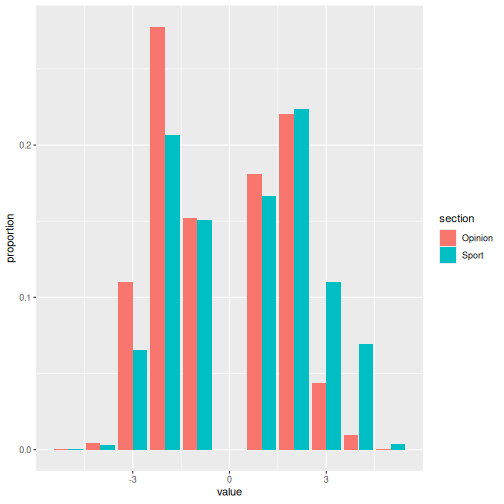
If we focus on the two sections Sport and Opinion, this is what it
looks like when we visualise it by means of ggplot().
R
articles_afinn |>
  count(section, value) |>
  group_by(section) |>
  mutate(proportion = n / sum(n)) |>
  ungroup() |>
  select(-n) |>
  filter(section %in% c("Sport", "Opinion"))  |>
  ggplot(mapping = aes(x = value, y = proportion, fill = section)) +
  geom_col(position = "dodge")
n-grams and correlations
So far we have been looking at words as individual units and not considered how they are related to the other words around them. It is possible to conduct an analysis that looks at the relationsships between words in our text.
Instead of using the unnest_tokens-function at singular
word level, as we have done so far, we will tokenize our text in to
sequences of words. These sequences are called n-grams. They allow us to
see how often a word is followed by another word. This gives us a chance
to look at the relationsship between words.
We no longer want to use articles_filteres, since this
has been tokenized word by word. We need a dataframe where
each article text is in a cell of its own. Therefore, we will go back to
our orginal object articles that contains all the articles
in their original state.
First we tokenise the text so that each cell contains two words.
R
articles_bigrams <- articles |>
 unnest_tokens(bigram, text, token = "ngrams", n = 2) |>
 filter(!is.na(bigram))
R
articles_bigrams
OUTPUT
# A tibble: 2,403,402 × 7
      id date    section region author                          wordcount bigram
   <dbl> <chr>   <chr>   <chr>  <chr>                               <dbl> <chr>
 1     1 2026-05 News    UK     Jessica Murray and Robert Booth      1328 brita…
 2     1 2026-05 News    UK     Jessica Murray and Robert Booth      1328 biome…
 3     1 2026-05 News    UK     Jessica Murray and Robert Booth      1328 watch…
 4     1 2026-05 News    UK     Jessica Murray and Robert Booth      1328 have …
 5     1 2026-05 News    UK     Jessica Murray and Robert Booth      1328 warne…
 6     1 2026-05 News    UK     Jessica Murray and Robert Booth      1328 that …
 7     1 2026-05 News    UK     Jessica Murray and Robert Booth      1328 natio…
 8     1 2026-05 News    UK     Jessica Murray and Robert Booth      1328 overs…
 9     1 2026-05 News    UK     Jessica Murray and Robert Booth      1328 of ai
10     1 2026-05 News    UK     Jessica Murray and Robert Booth      1328 ai po…
# ℹ 2,403,392 more rows
It looks much like the result of a tokenisation at singular word level, but the added column is now called bigram and contains two words
We can now count how many times word pair occurs.
R
articles_bigrams |>
  count(bigram, sort = TRUE)
OUTPUT
# A tibble: 923,094 × 2
   bigram       n
   <chr>    <int>
 1 of the   11380
 2 in the   10393
 3 to the    5100
 4 on the    4680
 5 and the   3755
 6 at the    3717
 7 to be     3575
 8 for the   3464
 9 in a      3211
10 with the  2909
# ℹ 923,084 more rows
Here we can see that the birams that tops the list are pairs of quite common words. Many of these are words that were defined as stopwords earlier. By removing pairs that contain at least one stopwords, we get at more meaningful result.
In order to be able to remove these pairs, we have to put each word
in its own column. We can do this by using the function
separate.
First we separate each pair into two columns. We to this by using the white space between the words as a separator.
R
bigrams_separated <- articles_bigrams |>
  separate(bigram, c("word1", "word2"), sep = " ")

bigrams_separated
OUTPUT
# A tibble: 2,403,402 × 8
      id date    section region author                     wordcount word1 word2
   <dbl> <chr>   <chr>   <chr>  <chr>                          <dbl> <chr> <chr>
 1     1 2026-05 News    UK     Jessica Murray and Robert…      1328 brit… biom…
 2     1 2026-05 News    UK     Jessica Murray and Robert…      1328 biom… watc…
 3     1 2026-05 News    UK     Jessica Murray and Robert…      1328 watc… have
 4     1 2026-05 News    UK     Jessica Murray and Robert…      1328 have  warn…
 5     1 2026-05 News    UK     Jessica Murray and Robert…      1328 warn… that
 6     1 2026-05 News    UK     Jessica Murray and Robert…      1328 that  nati…
 7     1 2026-05 News    UK     Jessica Murray and Robert…      1328 nati… over…
 8     1 2026-05 News    UK     Jessica Murray and Robert…      1328 over… of
 9     1 2026-05 News    UK     Jessica Murray and Robert…      1328 of    ai
10     1 2026-05 News    UK     Jessica Murray and Robert…      1328 ai    powe…
# ℹ 2,403,392 more rows
Once that is done, we remove the rows that contain a stopword in either of the two new columns.
R
bigrams_filtered <- bigrams_separated |>
  filter(!word1 %in% stop_words$word) |>
  filter(!word2 %in% stop_words$word)

bigrams_filtered
OUTPUT
# A tibble: 479,613 × 8
      id date    section region author                     wordcount word1 word2
   <dbl> <chr>   <chr>   <chr>  <chr>                          <dbl> <chr> <chr>
 1     1 2026-05 News    UK     Jessica Murray and Robert…      1328 brit… biom…
 2     1 2026-05 News    UK     Jessica Murray and Robert…      1328 biom… watc…
 3     1 2026-05 News    UK     Jessica Murray and Robert…      1328 nati… over…
 4     1 2026-05 News    UK     Jessica Murray and Robert…      1328 ai    powe…
 5     1 2026-05 News    UK     Jessica Murray and Robert…      1328 catch crim…
 6     1 2026-05 News    UK     Jessica Murray and Robert…      1328 tech… rapid
 7     1 2026-05 News    UK     Jessica Murray and Robert…      1328 rapid grow…
 8     1 2026-05 News    UK     Jessica Murray and Robert…      1328 metr… poli…
 9     1 2026-05 News    UK     Jessica Murray and Robert…      1328 past  12
10     1 2026-05 News    UK     Jessica Murray and Robert…      1328 12    mont…
# ℹ 479,603 more rows
Now we can make a new count of word pair.
R
bigram_counts <- bigrams_filtered |>
  count(word1, word2, sort = TRUE)

bigram_counts
OUTPUT
# A tibble: 347,703 × 3
   word1      word2            n
   <chr>      <chr>        <int>
 1 social     media          760
 2 artificial intelligence   392
 3 world      cup            293
 4 chief      executive      256
 5 donald     trump          243
 6 tech       companies      235
 7 south      africa         230
 8 premier    league         207
 9 final      cut            198
10 facial     recognition    191
# ℹ 347,693 more rows
This gives us a more meaningful set of word pairs.
If we want to combine the colums again, so that the words pairs
(without stopwords) are back in the same column, it can easily be done
by using the function unite
R
bigrams_united <- bigrams_filtered |>
  unite(bigram, word1, word2, sep = " ")

bigrams_united
OUTPUT
# A tibble: 479,613 × 7
      id date    section region author                          wordcount bigram
   <dbl> <chr>   <chr>   <chr>  <chr>                               <dbl> <chr>
 1     1 2026-05 News    UK     Jessica Murray and Robert Booth      1328 brita…
 2     1 2026-05 News    UK     Jessica Murray and Robert Booth      1328 biome…
 3     1 2026-05 News    UK     Jessica Murray and Robert Booth      1328 natio…
 4     1 2026-05 News    UK     Jessica Murray and Robert Booth      1328 ai po…
 5     1 2026-05 News    UK     Jessica Murray and Robert Booth      1328 catch…
 6     1 2026-05 News    UK     Jessica Murray and Robert Booth      1328 techn…
 7     1 2026-05 News    UK     Jessica Murray and Robert Booth      1328 rapid…
 8     1 2026-05 News    UK     Jessica Murray and Robert Booth      1328 metro…
 9     1 2026-05 News    UK     Jessica Murray and Robert Booth      1328 past …
10     1 2026-05 News    UK     Jessica Murray and Robert Booth      1328 12 mo…
# ℹ 479,603 more rows
Now we can seee how different word pairs, are used in different sections.
R
bigrams_united |>
  count(section, bigram, sort = TRUE) |>
  pivot_wider(
    names_from = section,
    values_from = n)
OUTPUT
# A tibble: 347,703 × 6
   bigram                   News Sport Lifestyle Opinion  Arts
   <chr>                   <int> <int>     <int>   <int> <int>
 1 social media              284    36       128     174   138
 2 world cup                   2   284        NA      NA     7
 3 artificial intelligence   262     5        12      64    49
 4 south africa                8   209         2       3     8
 5 premier league              1   203         2      NA     1
 6 final cut                  NA    NA       197      NA     1
 7 chief executive           186    23        17       9    21
 8 john lewis                  3    NA       169       1    10
 9 facial recognition        159    NA         1      26     5
10 tech companies            155    NA         5      57    18
# ℹ 347,693 more rows
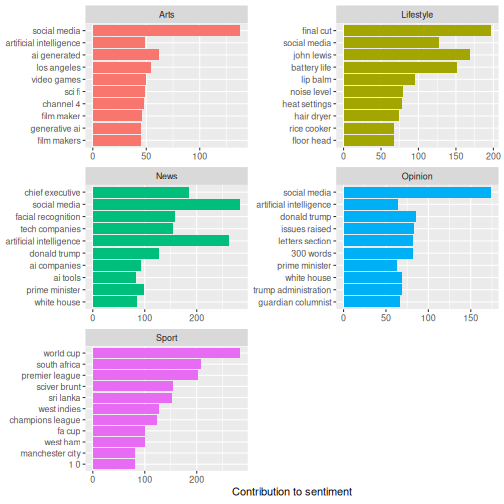
We could also have a look at the 10 most used bigrams in the different sections.
R
bigrams_united |>
  count(section, bigram, sort = TRUE) |>
  #ungroup() |>
  group_by(section) |>
  slice_max(n, n = 10) |>
  ungroup() |>
  mutate(bigram = reorder(bigram, n)) |>
  ggplot(mapping = aes(x = n, y = bigram, fill = section)) +
  geom_col(show.legend = FALSE) +
  facet_wrap(~section, scales = "free", ncol = 2) +
  labs(x = "Contribution to sentiment",
       y = NULL)
- Sentiments is the emotion or tone in a text
- There are different lexicons
- It is possible to add sentiments to words
- It is possible to visualise the sentiments
- It is possible to look at relationsship between words