Introduction
Figure 1
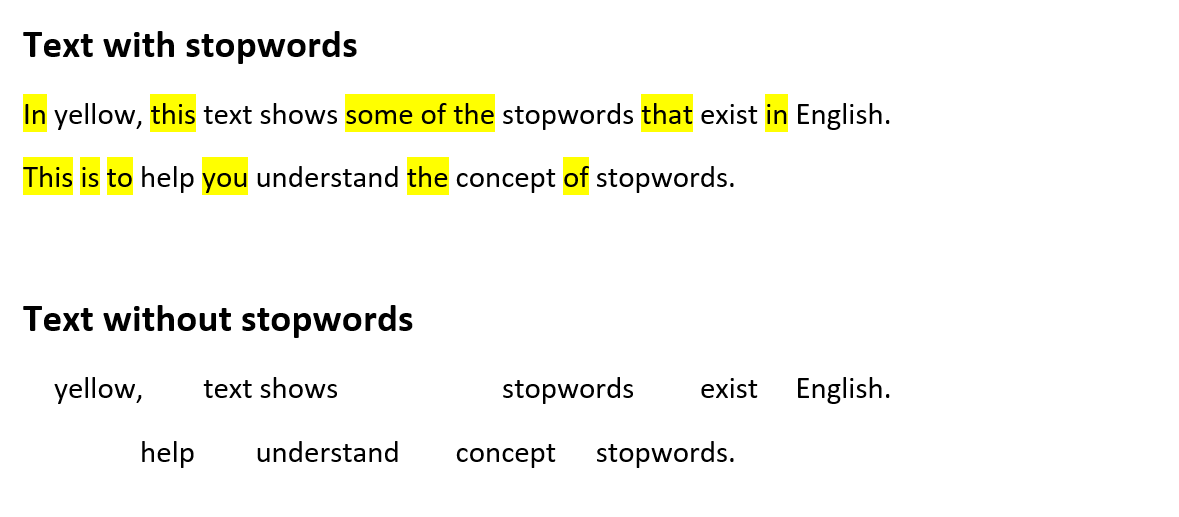
Figure 2
Loading data
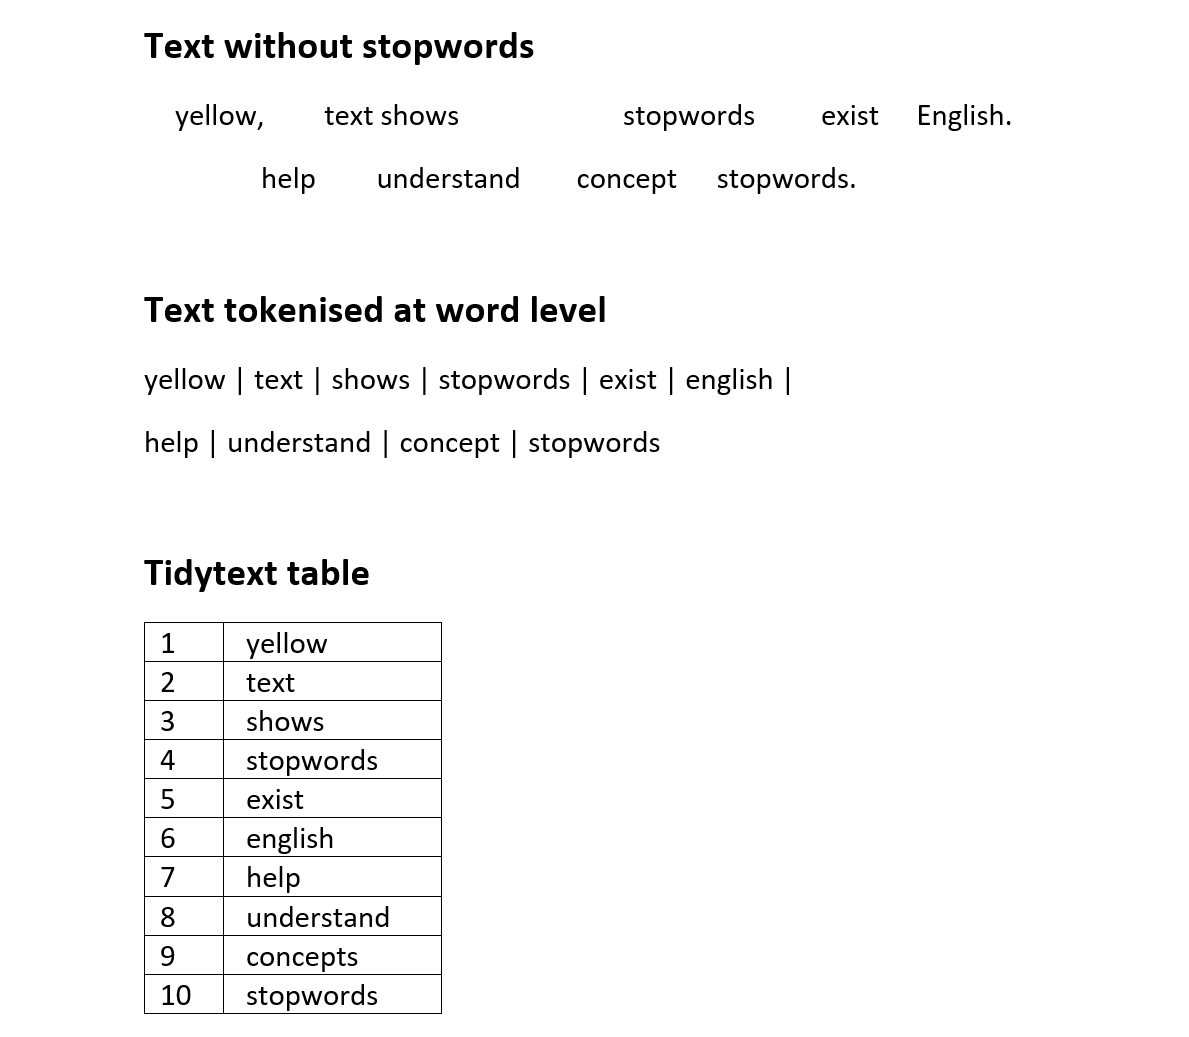
Tokenisation and stopwords
Figure 1
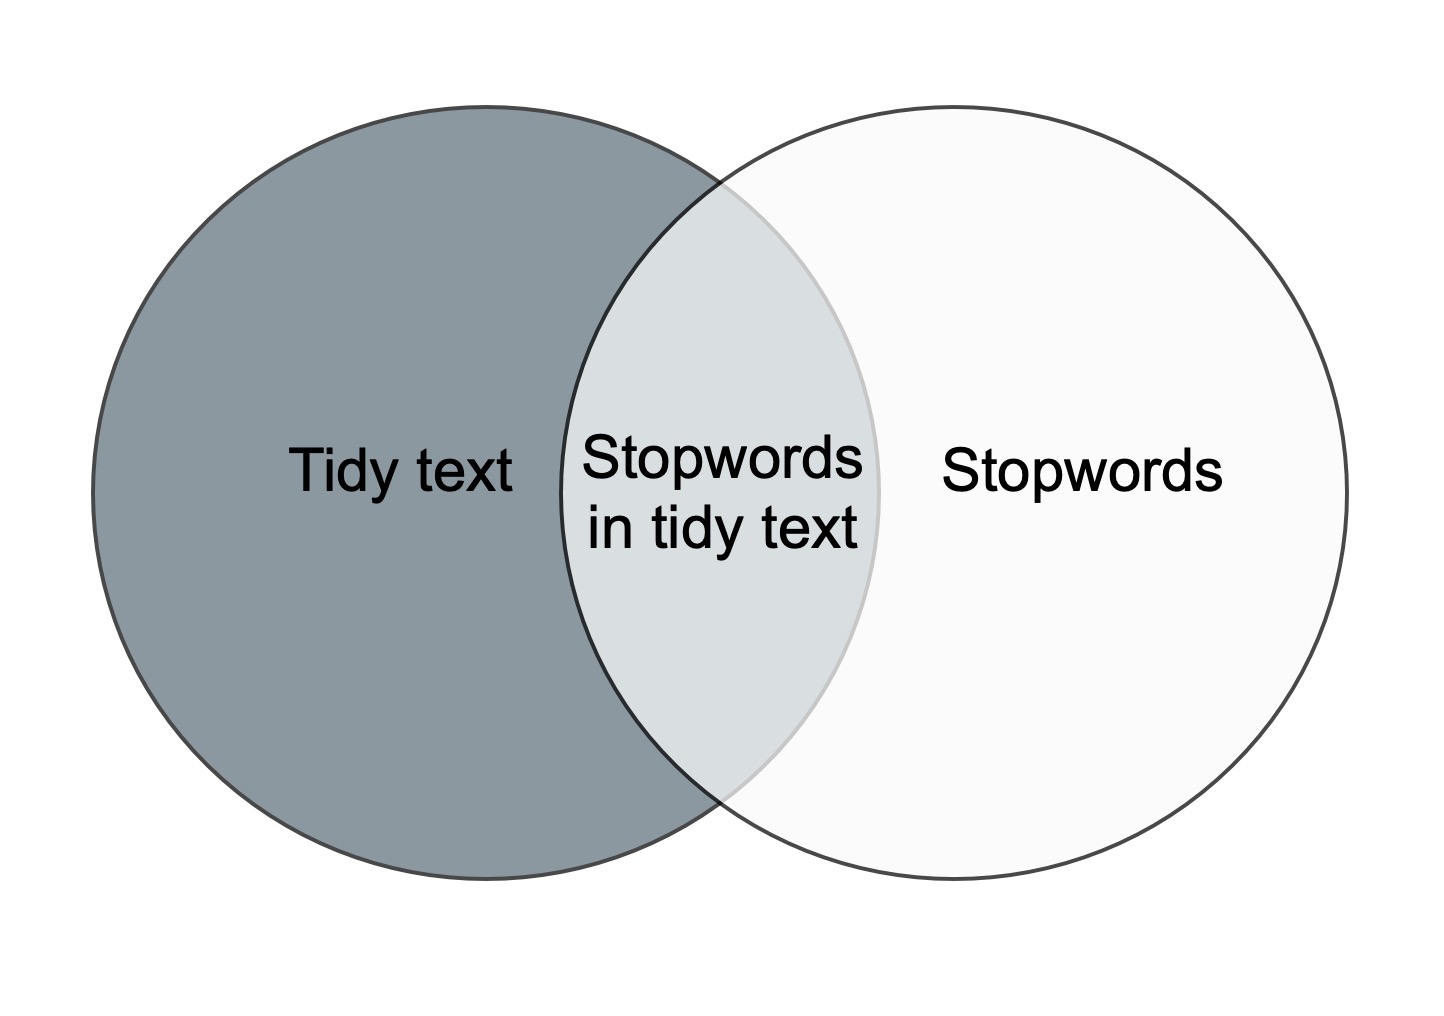
Anti-join examples
Word frequency analysis
Figure 1
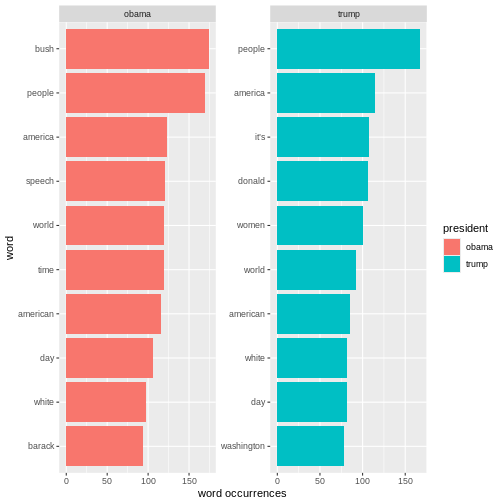
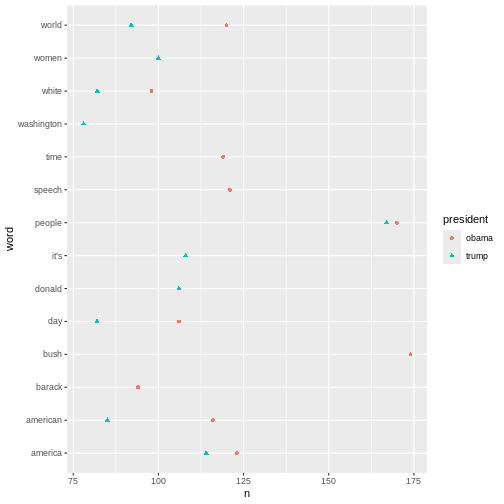 The plot above shows the top-ten words associated Obama and Trump
respectively. If a word features on both presidents’ top-ten list, it
only occurs once in the plot. This is why the plot doesn’t contain 20
words in total.
The plot above shows the top-ten words associated Obama and Trump
respectively. If a word features on both presidents’ top-ten list, it
only occurs once in the plot. This is why the plot doesn’t contain 20
words in total.
Figure 2
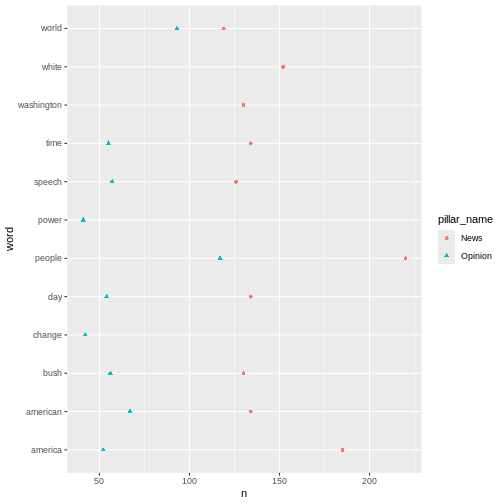
 The analyses just made can easily be adjusted. For instance, if we want
look at the words by
The analyses just made can easily be adjusted. For instance, if we want
look at the words by pillar_name instead of by
president, we simply replace president with
pillar_name in the code.
Figure 3
Sentiment analysis
Figure 1
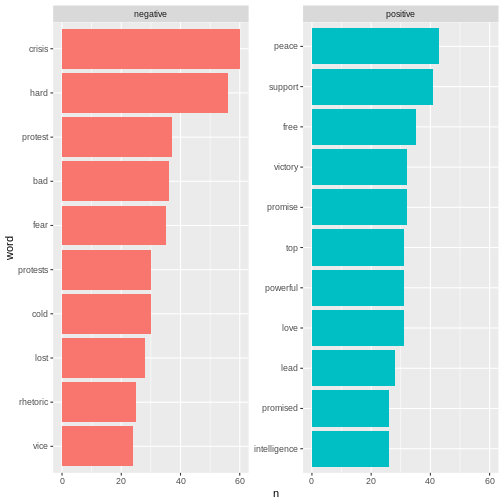 Here we can see the positive and negative words used in the
articles.
Here we can see the positive and negative words used in the
articles.