Correlations
Overview
Teaching: 42 min
Exercises: 47 minQuestions
FIXME
Objectives
FIXME
Correlations
If one variable goes up, what happens to the other variable? How are they correlated?
Scatterplots
What are they?
Shows the relation between two numeric variables. Each dot represents one observation. The position of the dot on the X-axis (horisontal, AKA abscissa), represents the value of the first variable for that observation. The position of the dot on the Y-axis (vertical, AKA ordinate), represents the value of the second variable for that observation.
Warning: Removed 2 rows containing missing values (`geom_point()`).

plot of chunk scatter-what
What do we use them for?
Typically used to show the relation between two variables.
how do we make them?
The geom_point() function makes the scatterplot. We need to provide the mapping of two variables:
ggplot(penguins, aes(x=body_mass_g, y=flipper_length_mm)) +
  geom_point()
Warning: Removed 2 rows containing missing values (`geom_point()`).
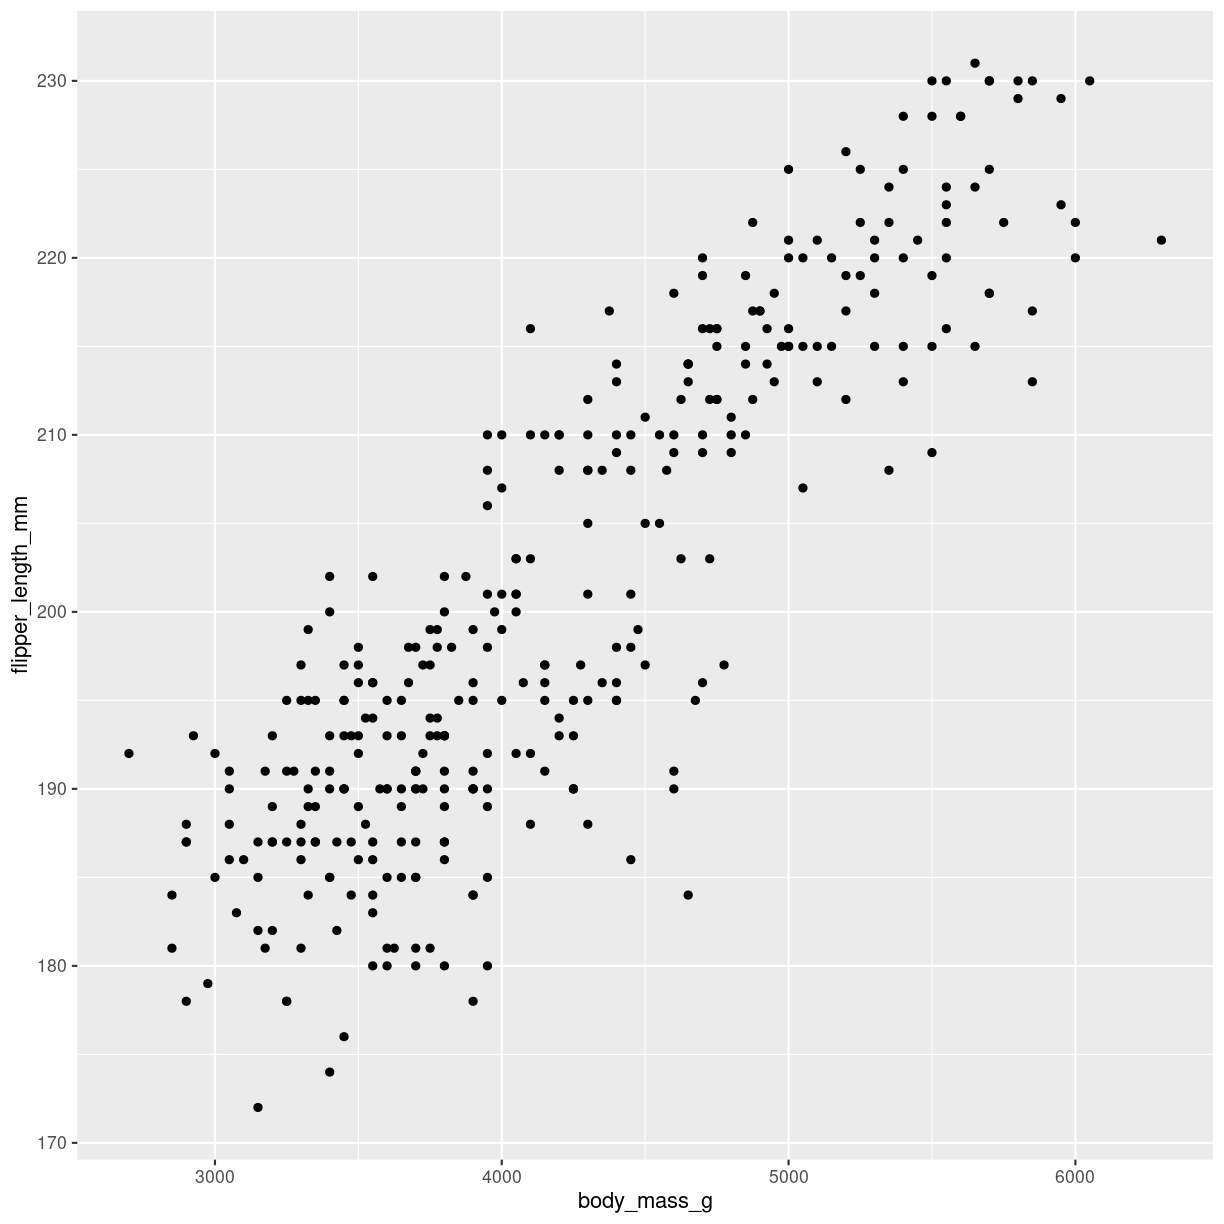
plot of chunk scatter-how
Interesting variations
all combinations
også kendt som corellogram, der dukker op senere.
Since scatterplots provides a quick way of visualizing the correlation between two variables, it can be useful to visualize all combinations of two variables in our data.
Base-R does it like this:
plot(penguins)
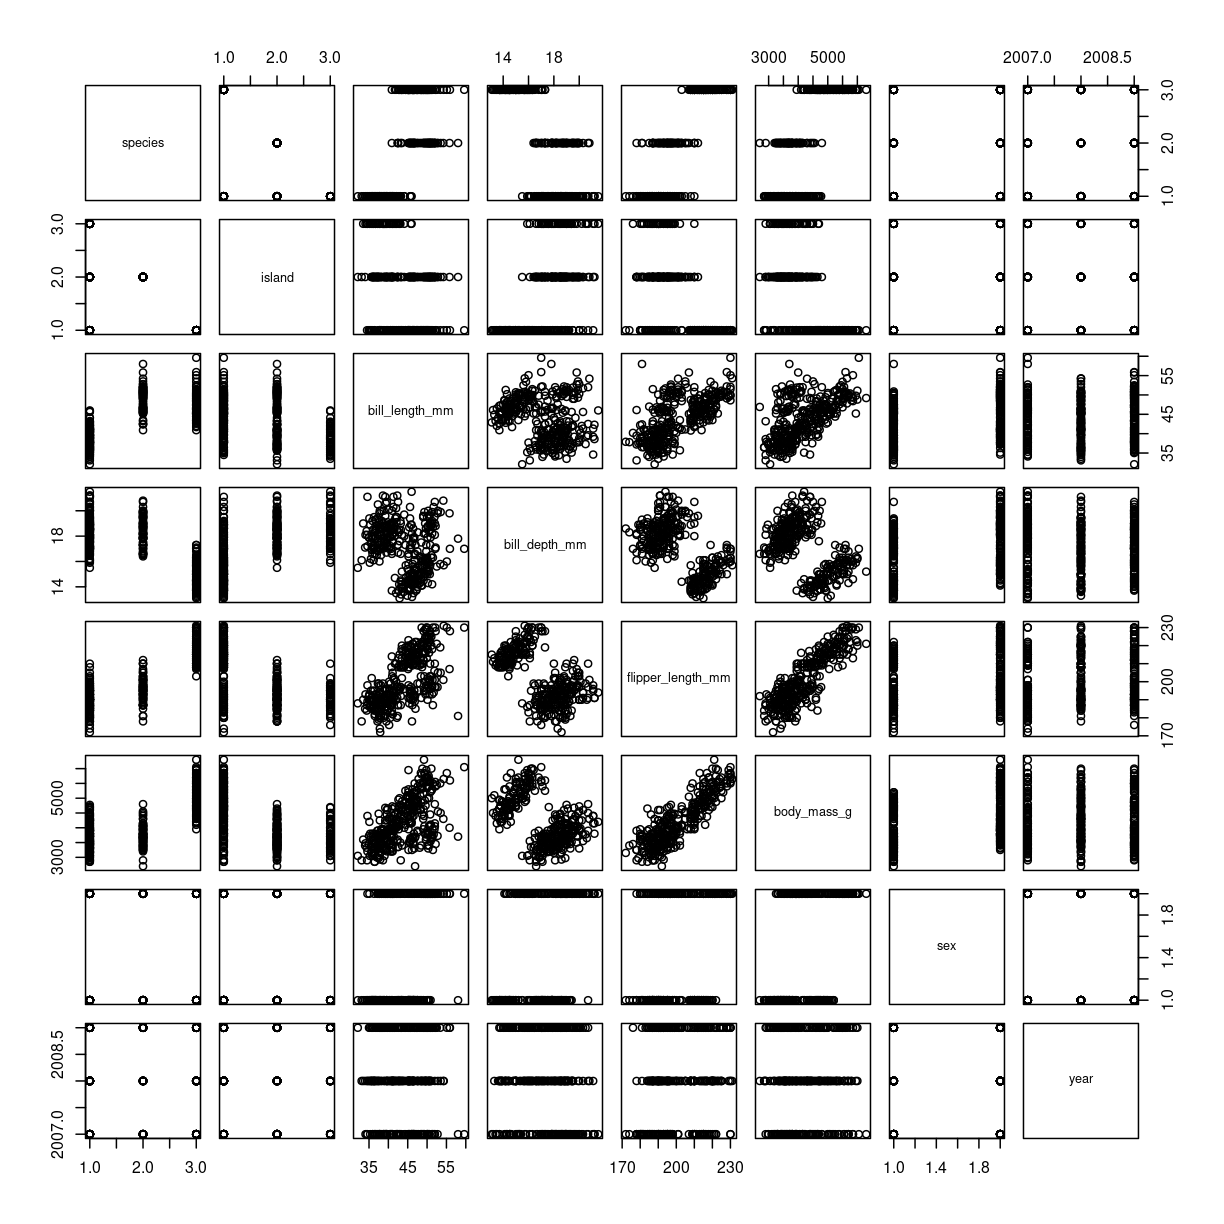
plot of chunk scatter-matrix
The package GGally provides a function ggpairs that does this in the
ggplot2 universe, making it easy to adjust the plot subsequently.
ggpairs(penguins)
Warning: Removed 2 rows containing non-finite values (`stat_boxplot()`).
Removed 2 rows containing non-finite values (`stat_boxplot()`).
Removed 2 rows containing non-finite values (`stat_boxplot()`).
Removed 2 rows containing non-finite values (`stat_boxplot()`).
Removed 2 rows containing non-finite values (`stat_boxplot()`).
Removed 2 rows containing non-finite values (`stat_boxplot()`).
Removed 2 rows containing non-finite values (`stat_boxplot()`).
Removed 2 rows containing non-finite values (`stat_boxplot()`).
`stat_bin()` using `bins = 30`. Pick better value with `binwidth`.
Warning: Removed 2 rows containing non-finite values (`stat_bin()`).
`stat_bin()` using `bins = 30`. Pick better value with `binwidth`.
Warning: Removed 2 rows containing non-finite values (`stat_bin()`).
Warning: Removed 2 rows containing non-finite values (`stat_density()`).
Warning in ggally_statistic(data = data, mapping = mapping, na.rm = na.rm, :
Removed 2 rows containing missing values
Warning in ggally_statistic(data = data, mapping = mapping, na.rm = na.rm, :
Removed 2 rows containing missing values
Warning in ggally_statistic(data = data, mapping = mapping, na.rm = na.rm, :
Removed 2 rows containing missing values
Warning: Removed 2 rows containing non-finite values (`stat_boxplot()`).
Warning in ggally_statistic(data = data, mapping = mapping, na.rm = na.rm, :
Removed 2 rows containing missing values
`stat_bin()` using `bins = 30`. Pick better value with `binwidth`.
Warning: Removed 2 rows containing non-finite values (`stat_bin()`).
`stat_bin()` using `bins = 30`. Pick better value with `binwidth`.
Warning: Removed 2 rows containing non-finite values (`stat_bin()`).
Warning: Removed 2 rows containing missing values (`geom_point()`).
Warning: Removed 2 rows containing non-finite values (`stat_density()`).
Warning in ggally_statistic(data = data, mapping = mapping, na.rm = na.rm, :
Removed 2 rows containing missing values
Warning in ggally_statistic(data = data, mapping = mapping, na.rm = na.rm, :
Removed 2 rows containing missing values
Warning: Removed 2 rows containing non-finite values (`stat_boxplot()`).
Warning in ggally_statistic(data = data, mapping = mapping, na.rm = na.rm, :
Removed 2 rows containing missing values
`stat_bin()` using `bins = 30`. Pick better value with `binwidth`.
Warning: Removed 2 rows containing non-finite values (`stat_bin()`).
`stat_bin()` using `bins = 30`. Pick better value with `binwidth`.
Warning: Removed 2 rows containing non-finite values (`stat_bin()`).
Warning: Removed 2 rows containing missing values (`geom_point()`).
Removed 2 rows containing missing values (`geom_point()`).
Warning: Removed 2 rows containing non-finite values (`stat_density()`).
Warning in ggally_statistic(data = data, mapping = mapping, na.rm = na.rm, :
Removed 2 rows containing missing values
Warning: Removed 2 rows containing non-finite values (`stat_boxplot()`).
Warning in ggally_statistic(data = data, mapping = mapping, na.rm = na.rm, :
Removed 2 rows containing missing values
`stat_bin()` using `bins = 30`. Pick better value with `binwidth`.
Warning: Removed 2 rows containing non-finite values (`stat_bin()`).
`stat_bin()` using `bins = 30`. Pick better value with `binwidth`.
Warning: Removed 2 rows containing non-finite values (`stat_bin()`).
Warning: Removed 2 rows containing missing values (`geom_point()`).
Removed 2 rows containing missing values (`geom_point()`).
Removed 2 rows containing missing values (`geom_point()`).
Warning: Removed 2 rows containing non-finite values (`stat_density()`).
Warning: Removed 2 rows containing non-finite values (`stat_boxplot()`).
Warning in ggally_statistic(data = data, mapping = mapping, na.rm = na.rm, :
Removed 2 rows containing missing values
`stat_bin()` using `bins = 30`. Pick better value with `binwidth`.
Warning: Removed 2 rows containing non-finite values (`stat_bin()`).
`stat_bin()` using `bins = 30`. Pick better value with `binwidth`.
Warning: Removed 2 rows containing non-finite values (`stat_bin()`).
`stat_bin()` using `bins = 30`. Pick better value with `binwidth`.
Warning: Removed 2 rows containing non-finite values (`stat_bin()`).
`stat_bin()` using `bins = 30`. Pick better value with `binwidth`.
Warning: Removed 2 rows containing non-finite values (`stat_bin()`).
Warning: Removed 11 rows containing missing values (`stat_boxplot()`).
`stat_bin()` using `bins = 30`. Pick better value with `binwidth`.
`stat_bin()` using `bins = 30`. Pick better value with `binwidth`.
Warning: Removed 2 rows containing missing values (`geom_point()`).
Warning: Removed 2 rows containing missing values (`geom_point()`).
Removed 2 rows containing missing values (`geom_point()`).
Removed 2 rows containing missing values (`geom_point()`).
`stat_bin()` using `bins = 30`. Pick better value with `binwidth`.
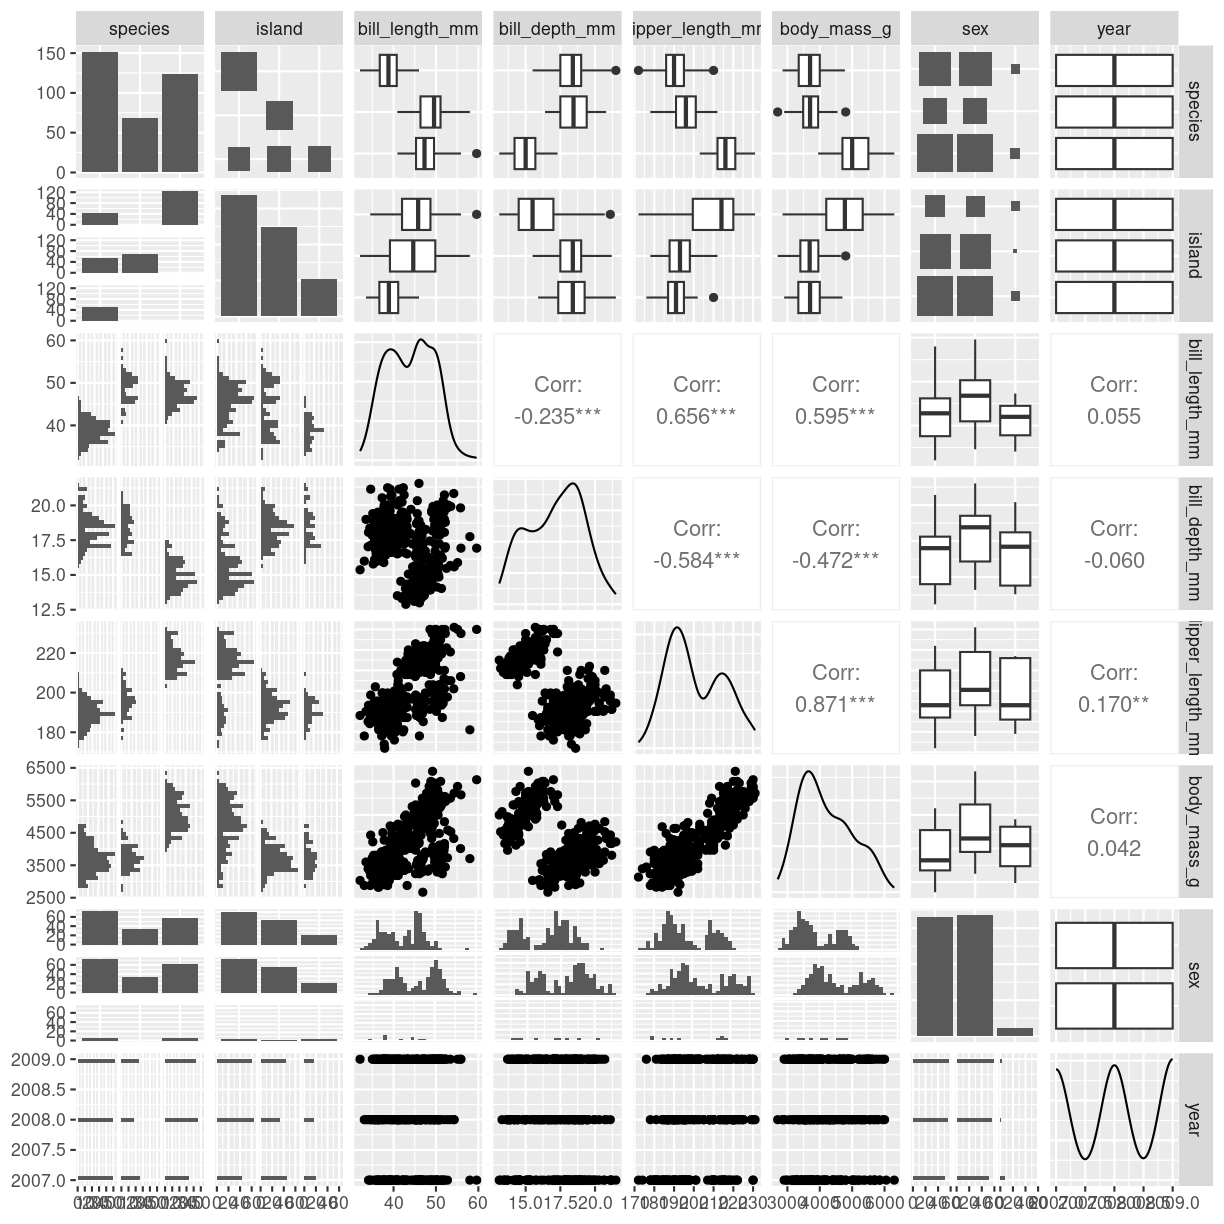
plot of chunk scatter-matrix-ggally
Be careful - the plot can get very busy!
coloring
ggplot(penguins, aes(x=body_mass_g, y=flipper_length_mm, color = species)) +
  geom_point()
Warning: Removed 2 rows containing missing values (`geom_point()`).
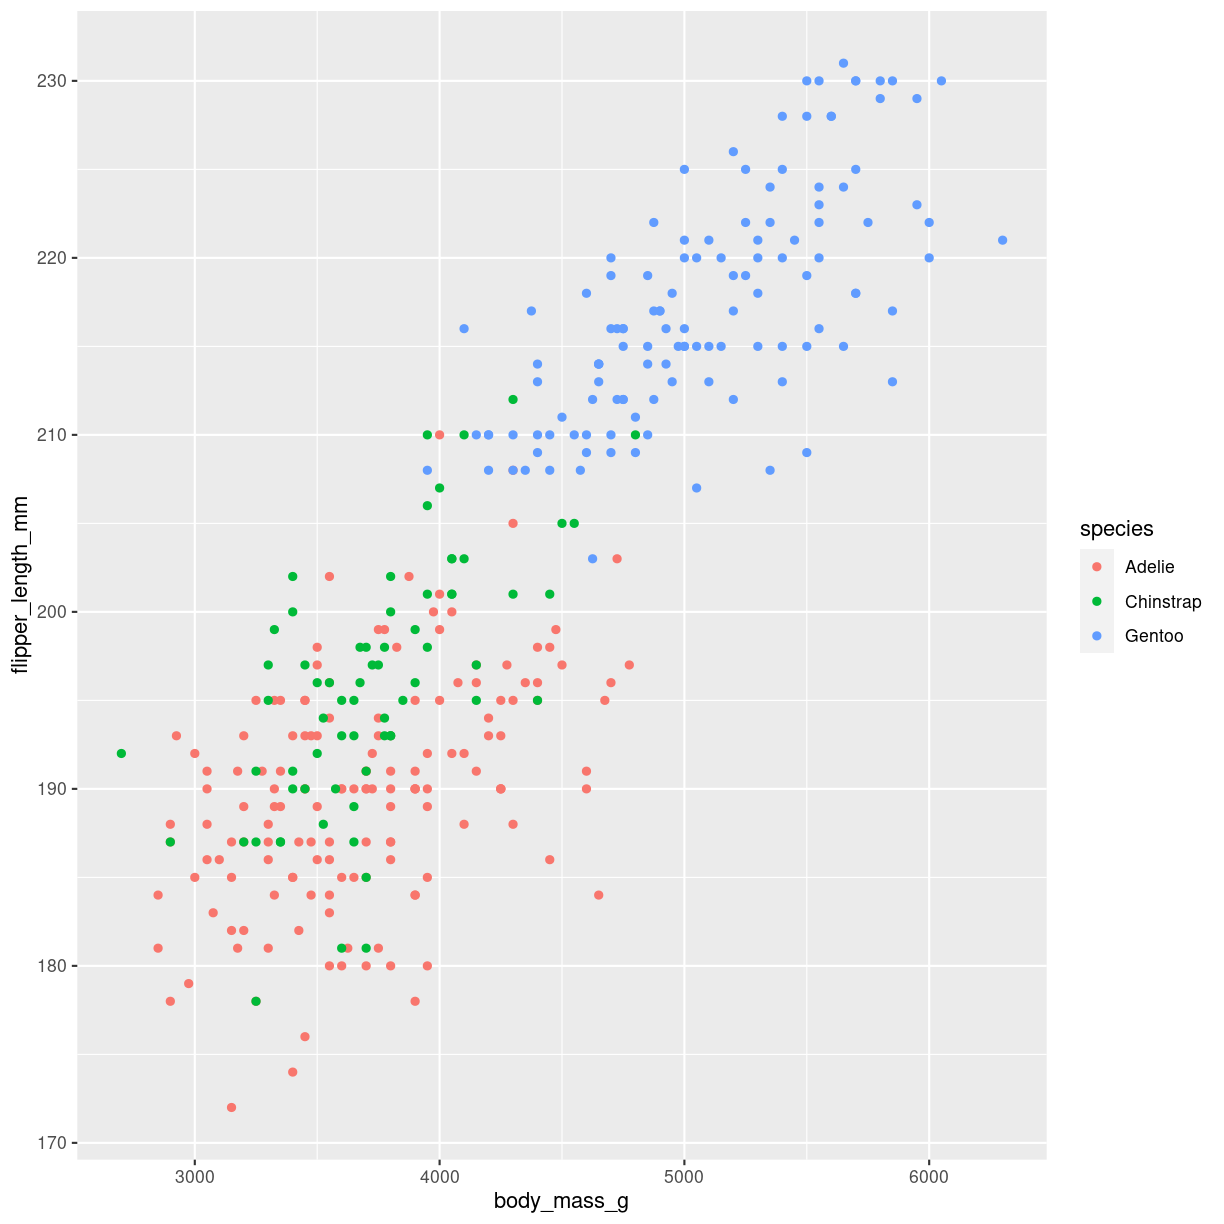
plot of chunk scatter-how-color
marginal distibution
Scatterplots kan udvides med plots på margenen: Det er ggmarginal fra ggextra der skal på banen hvis det skal være let.
p <- penguins %>%
  ggplot(aes(flipper_length_mm, body_mass_g)) +
  geom_point()
ggMarginal(p, type = "histogram")
Warning: Removed 2 rows containing missing values (`geom_point()`).
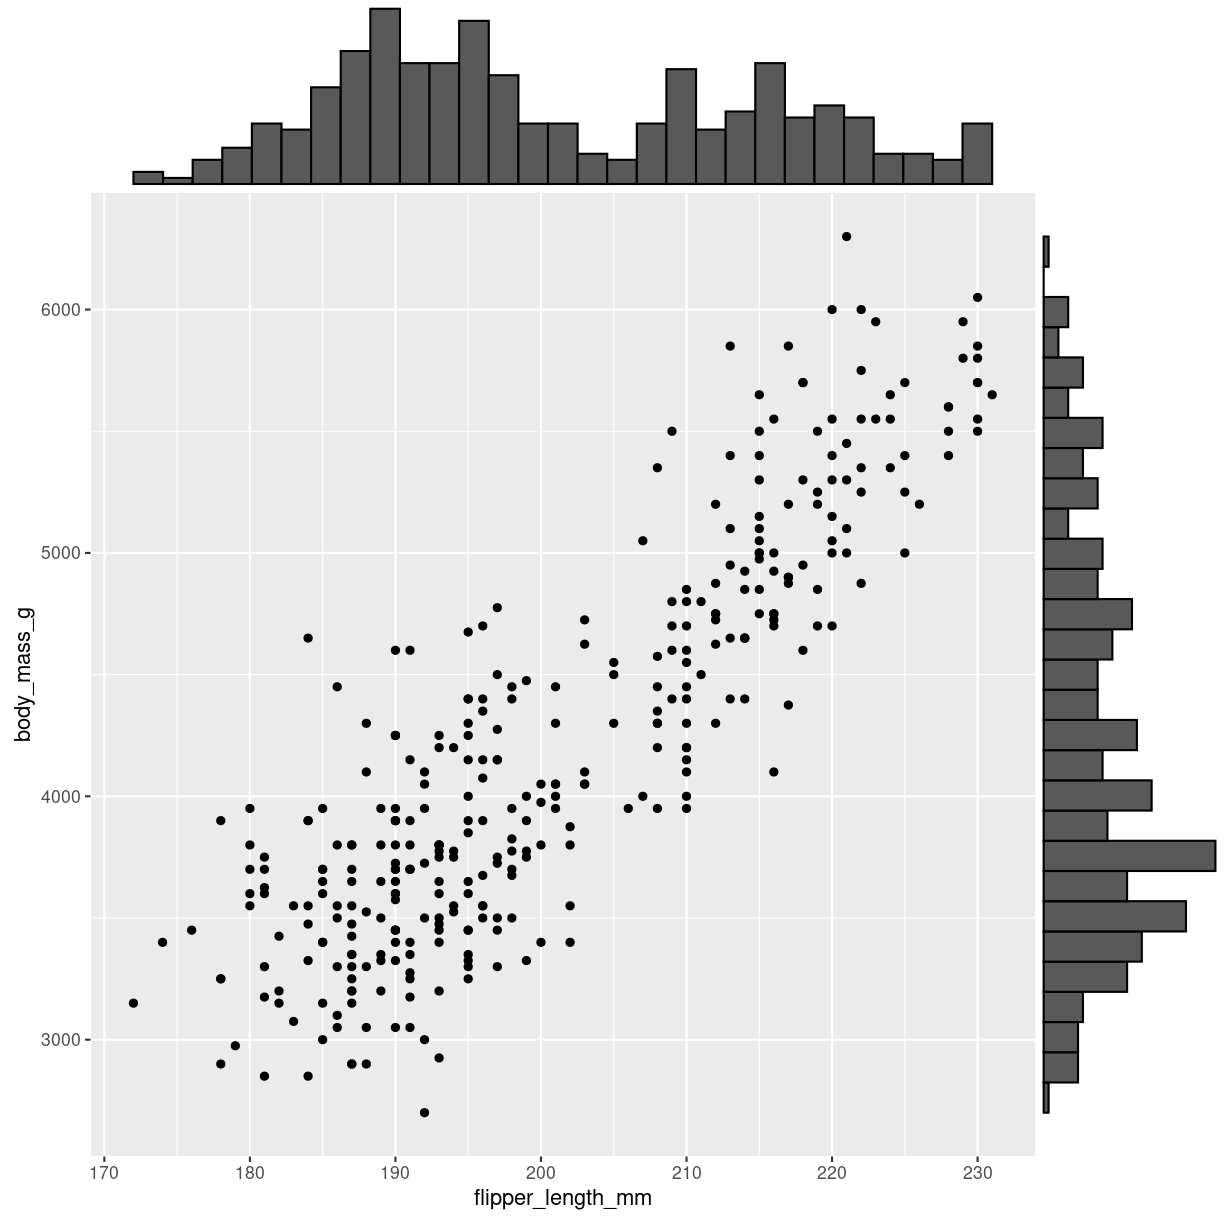
plot of chunk scatter_marginal_histogram
Bemærk at det ggmarginal element der kommer ud af det, ikke er helt let at arbejde videre med. Pak det ind i wrap_elements() fra patchwork pakken, så kører det.
Der er yderligere muligheder:
Warning: Removed 2 rows containing missing values (`geom_point()`).
Removed 2 rows containing missing values (`geom_point()`).
Removed 2 rows containing missing values (`geom_point()`).
Warning: The dot-dot notation (`..density..`) was deprecated in ggplot2 3.4.0.
ℹ Please use `after_stat(density)` instead.
ℹ The deprecated feature was likely used in the ggExtra package.
  Please report the issue at <https://github.com/daattali/ggExtra/issues>.
This warning is displayed once every 8 hours.
Call `lifecycle::last_lifecycle_warnings()` to see where this warning was
generated.
Warning: Removed 2 rows containing missing values (`geom_point()`).
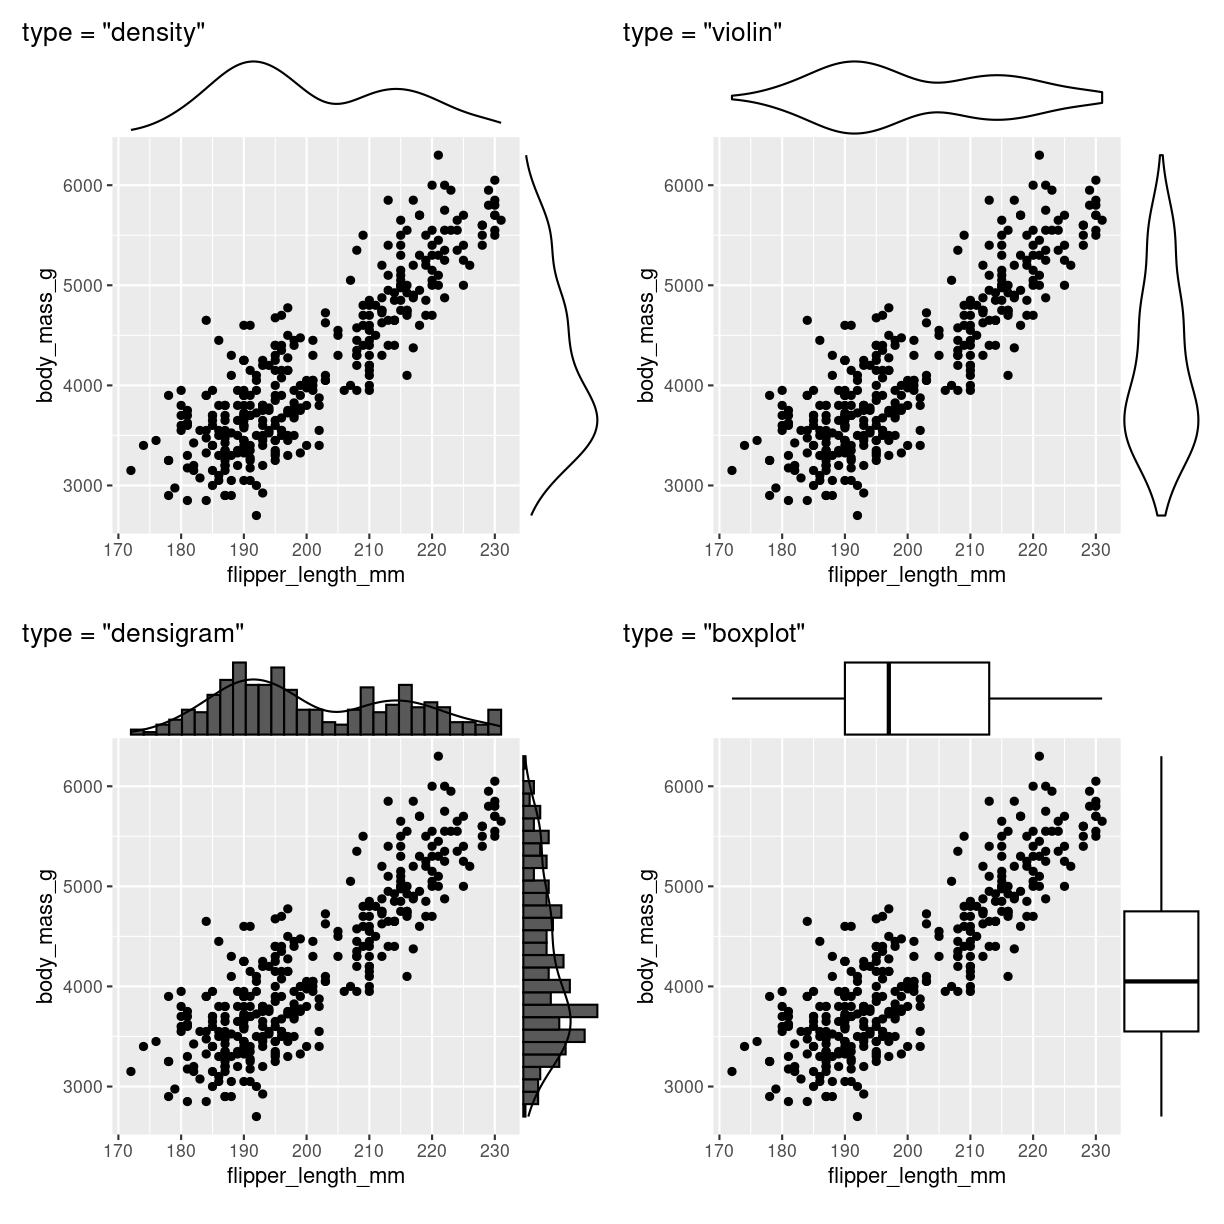
plot of chunk scatter_marginal_flere
Think about
Overlapping points
Connected scatter
What are they?
https://r-graph-gallery.com/connected_scatterplot_ggplot2.html
What do we use them for?
how do we make them?
Interesting variations
Think about
heatmap
What are they?
https://r-graph-gallery.com/heatmap.html
What do we use them for?
how do we make them?
Interesting variations
Correlogram
What are they?
What do we use them for?
how do we make them?
Interesting variations
Bubble
https://r-graph-gallery.com/bubble-chart.html
What are they?
Et scatterplot hvor der plottes cirkler. En tredie numerisk variabel er mappet til størrelse af cirklen.
What do we use them for?
how do we make them?
Interesting variations
Density 2D
Et scatterplot, hvor en farvegradient beregnes efter hvor mange punkter der ligger omkring en koordinat.
What are they?
What do we use them for?
how do we make them?
Interesting variations
Key Points
FIXME