Reading data from file
Last updated on 2026-06-15 | Edit this page
Estimated time: 12 minutes
Overview
Questions
- How do you read in data from files?
Objectives
- Explain how to read in data from a selection of different data files.
Introduction
The first step of doing dataanalysis, is normally to read in the data.
Data can come from many different sources, and it is practically impossible to cover every possible format. Here we cover some of the more common.
The most important point is that there is a very high probability that at least one package exists that is designed to read a specific weird data format.
Use code!
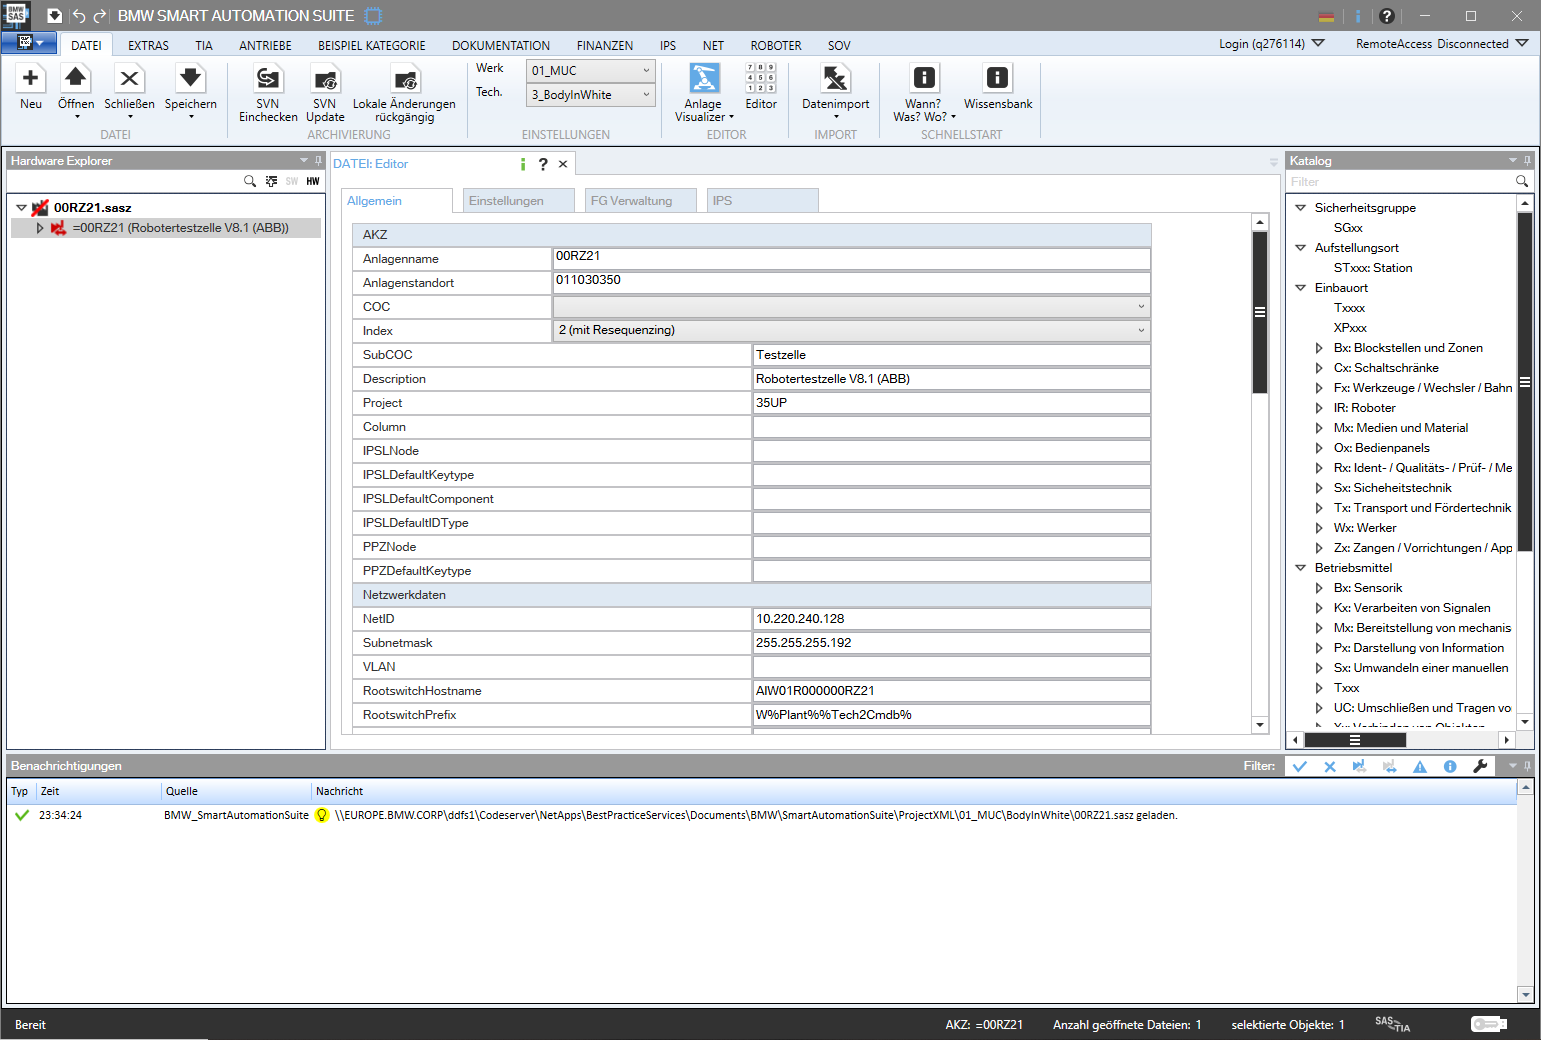
RStudio makes it simple to load most common data formats: Click on the file in the “Files” tab in RStudio, and choose “Import Dataset”:
RStudio will then provide an interface for loading the data:
However in general we prefer to have a script or a document, that can be run without us pointing and clicking. So - instead of importing the data in this way, copy the code that RStudio uses to import the data, and paste it into your script or document.
This option does not yet exist in Positron.
CSV-files
The most basic file type for storing and transferring data. A “simple” textfile, containing tabular data. One line of text for each row of data, each cell in that row, corresponding to a column, separated with a separator, typically a comma.
Many languages use commas as decimal separators. That neccesitates an option for using something else than a comma. Typically a semicolon.
Truly commaseparated files
Use read.csv() (from base-R) or read_csv()
(from readr, included in tidyverse)
We recommend using read_csv().
Semicolon separated files
Use read.csv2() (from base-R) or
read_csv2() (from readr, included in
tidyverse)
We recommend read_csv2()
What they have in common
read_csv and read_csv2 take a lot of
arguments that can control datatypes, handling of headers etc. For most
use, the default options are enough, but if you need to adjust
something, there are plenty of options for that.
guess_max
read_csv and read_csv2 tries to guess the
datatypes in the file, and will convert the data accordingly. That will
return a dataframe where date-time data is stored as such. The functions
by default reads the first 1000 rows, and makes a guess on the datatype
based on that.
That can lead to problems if the first 1000 rows of a column contain
numbers, and row 1001 contains text. In that case the entire row will be
coerced to numeric, and the following rows will contain
NA values. Adjust the argument guess_max to
something larger to catch this problem.
To include every row in the guess, add guess_max = Inf -
but be careful if you have a very large dataset.
Excel-files
Use the readxl package. Excel comes in two variants,
xls and xlsx. read_excel() makes
a qualified quess of the actual type your excel-file is. Should we need
to specify, we can use read_xls() or
read_xlsx().
Workbooks often contains more than one sheet. We can specify which we want to read in:
read_excel(path = "filename", sheet = 2)
Which will read in sheet number 2 from the workbook “filename”.
Read the documentation for details on how to read in specific cells
or ranges. You can find it running ?read_excel, or
help(read_excel).
SPSS
SPSS, originally “Statistical Package for the Social Sciences”, later renamed “Statistical Product and Service Solutions” is a proprietary statistical software suite developed by IBM.
Not surprisingly it is widely used in social science.
The package haven supports reading SPSS (Stata and SAS)
files
Use the package to read in spss files:
R
library(haven)
read_spss("filename")
The function returns a tibble.
Note that SPSS uses a variety of different formats.
read_spss() will make a guess of the correct format, but if
problems arise, try using one of the other functions provided in
haven
Stata
Stata is a proprietary statistical software package, used in a multitude of different fields, primarily biomedicine, epidemiololy, sociology and economics.
As mentioned above, the haven package provides functions
for reading Stata files:
R
library(haven)
read_stata("filename")
The function returns at tibble.
As with SPSS Stata uses a couple of different fileformats, and
read_stata makes a guess as to which format is used. If
problems arise, haven has more specific functions for
reading specific file formats.
SAS
SAS is a proprietary statistical software suite developed by SAS Institute.
The package haven can read SAS-files:
R
library(haven)
read_sas("filename")
The function returns at tibble.
As with SPSS and Stata, SAS uses a couple of different fileformats,
and read_sas tries to guess the correct format.
If problems arise, haven has more specific functions for
reading specific file formats.
JSON
Not all data come in a nice rectangular format, note the multiple phone numbers for the White House:
CountryUSA |
NameNASA |
Phonenumber
|
|
| White House |
(202)-456-1111 |
||
| Russia | Kremlin | 0107-095-295-9051 | |
| Vatican | The Pope | 011-39-6-6982 | |
There are two locations in the US, and one of them have two phone numbers. These kinds of structures, where one row contains data with more than one row (etc), are called nested, and are often stored or distributed in the JSON-format.
JSON can be read using fromJSON() from the
jsonlite library.
R
library(jsonlite)
fromJSON("filename")
Note that you will end up with nested columns - containing lists - which you probably will have to handle afterwards.
Other formats
In general if a piece of software is in widespread enough use that you encounter the weird file-format it uses, someone will have written a package for reading it. Google is your friend here!
Also, if you encounter a really weird dataformat, please send us an example so we can expand our knowledge.
- The
readrversion ofread_csv()is preferred - Remember that csv is not always actually separated with commas.
- The
havenpackage contains functions for reading common proprietary file formats. - In general a package will exist for reading strange datatypes. Google is your friend!
- Use code to read in your data